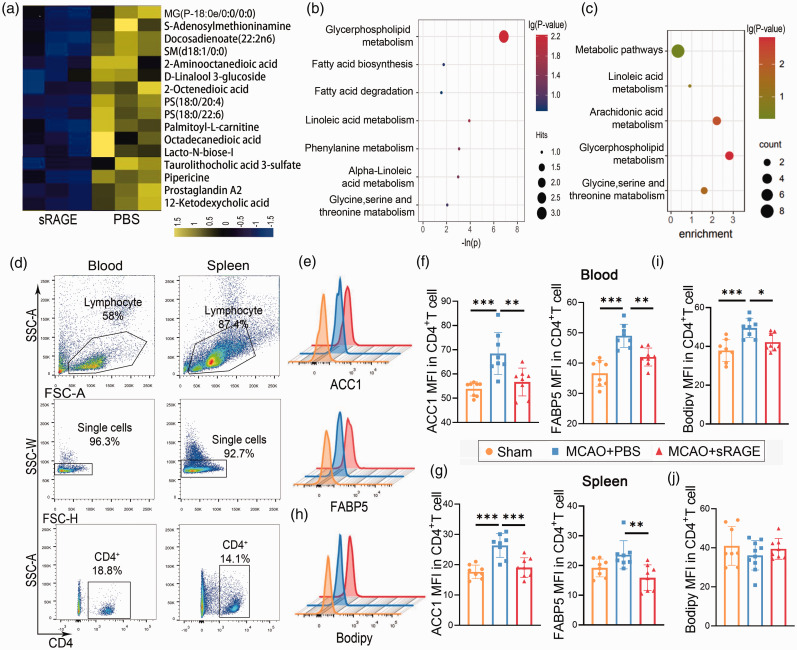
Figure 3.
Neutralization of RAGE reverses the metabolic reprogramming of CD4+ T cells after stroke. A: Different metabolites of peripheral CD4+ T cells were detected in metabolomics in sRAGE‐treated and PBS-treated mice after MCAO. B: Metabolic analysis of the significantly altered metabolites. C: KEGG analysis of the significantly altered metabolites. D: Representative dot plots and gating strategy for CD4+ T cells sorting followed by flow cytometry. E: Representative image of flow cytometry for ACC1 and FABP5 on CD4+ T cells. F-G: Quantification of mean fluorescent intensity (MFI) of labeled ACC1 and FABP5 on CD4+T cells from blood (F) and spleen (G). H-J: Representative image and quantification of Bodipy flow cytometry on CD4+T cells from blood (I) and spleen (J). n = 8 per group. Data are expressed as mean±SD. *P ≤ 0.05. One‐way ANOVA, Bonferroni post hoc test.

