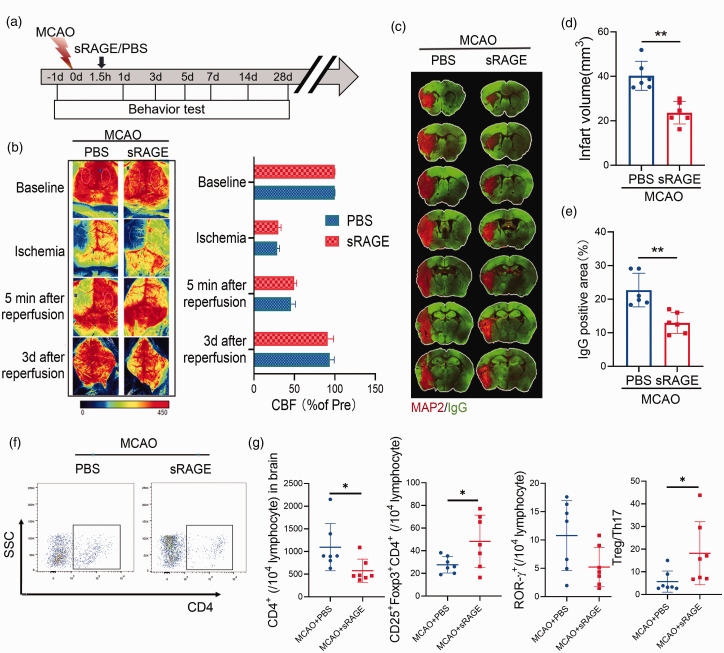
Figure 5.
Neutralization of RAGE reduces infarct volume after stroke. (A) Schematic representation of the experimental design. (B) Cerebral blood flow monitored using 2-dimensional laser speckle imaging techniques before, during middle cerebral artery occlusion (MCAO), 5 min and 3 d after reperfusion. Results were expressed as percent change from baseline (pre-MCAO). C: Representative MAP2 staining of brain infarct and endogenous mouse IgG staining of BBB leakage 3 day after stroke in mice treated with sRAGE or PBS. n = 6 per group. D: Quantification of infarct volume 3 day after stroke in mice treated with sRAGE or PBS was determined by immunostaining of in the parenchyma. E: Quantification of endogenous IgG positive area. n = 6 per group. A two-tailed Student’s t-test. F-G: Representative flow cytometric plots (F) and quantitative analysis of CD4+, CD25+Foxp3+CD4+, CD4+ROR-γ+ T cells (B) and Treg/Th17 radio (G) from the brain of sRAGE/PBS‐treated mice 3 days after MCAO. n = 7 per group. Data are expressed as mean ± SD. P > 0.05, *P ≤ 0.01, ***P ≤ 0.001. One‐way ANOVA, Bonferroni post hoc test.

