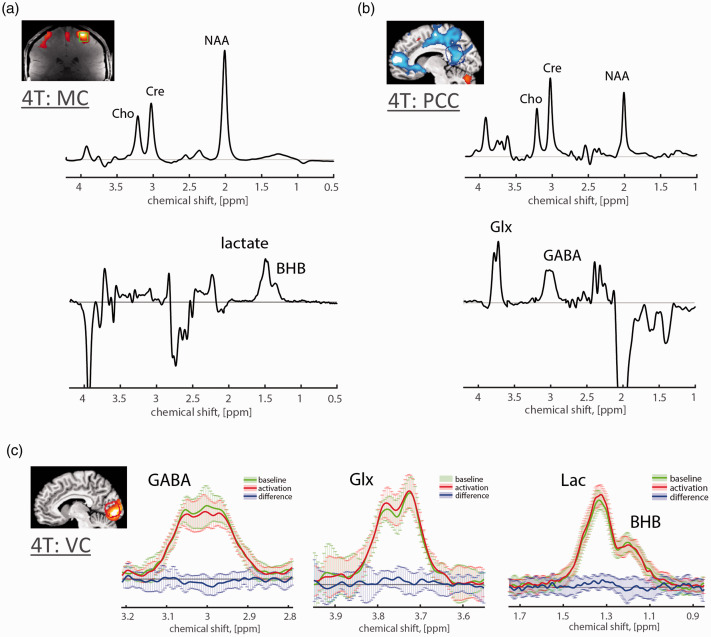
Figure 2.
J-difference edited fMRS in human brain at 4 T. JDE 1H MRS allows for high quality spectra observations of such low concentration metabolites as Lac (0.2–1 mM), pooled Glu (6–12.5 mM) and Gln (3–6 mM) termed as Glx, GABA (1–2 mM) and BHB (<0.5 mM) using MEGA-PRESS or MEGA-sLASER sequences at relatively low magnetic field (Table 1). For baseline condition, conventional group (a) average motor cortex (MC) JDE sum spectra for Lac JDE (TE = 144 ms) and (b) average posterior cingulate cortex (PCC) JDE spectra for GABA/Glx JDE (TE = 71 ms) using MEGA-sLASER sequence at 4 T.53,54 Note that the difference GABA spectrum contains flipped NAA peak due to the subtraction between the NAA amplitude-distorted spectrum (by the editing ON pulse applied adjacent to NAA) and editing OFF spectrum with unaffected NAA peak. (c) For flashing checkerboard paradigm at 4T, group average J-difference spectra for activated VC baseline (green), condition (red) and their difference (blue; decrease in GABA −5.7 ± 3.3% from baseline level 2.22 ± 0.33 mM, increase in Glx 3.0 ± 2.1% from baseline level 1.50 ± 0.21a.u., increase in Lac 7.8 ± 5.4% from baseline level 0.99 ± 0.13 mM, and no changes in BHB). 54 Shaded error bars denote standard deviation.

