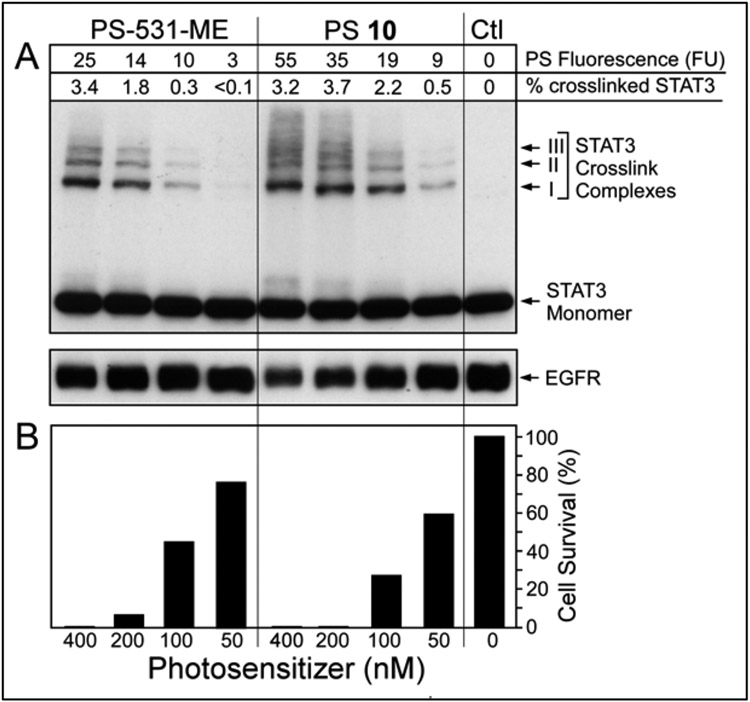
Figure 5.
PS-dose dependent photoreaction in HN-85-1-3 T-EC. Level of PS taken up was quantified by fluorescence prior to 665 nm light treatment (3 J/cm2). A, Immunoblot analysis of STAT3 and EGFR immediately after light treatment. B, Duplicate cultures were incubated for 24 h after PDT and then the percentage of surviving cells determined.

