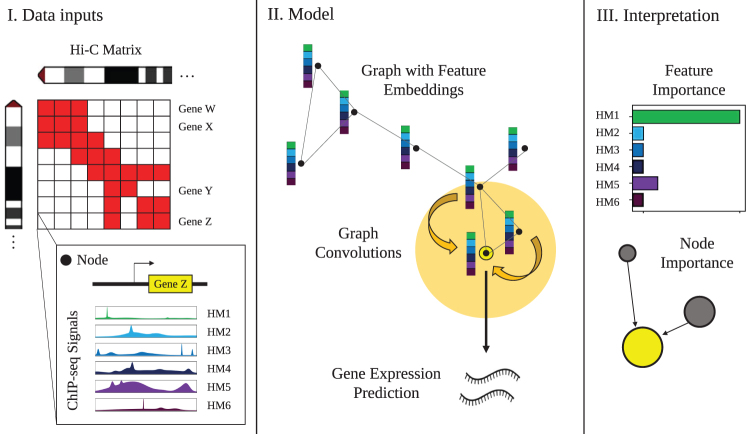
FIG. 1.
Overview of GC-MERGE. Our framework integrates local HM signals and long-range spatial interactions among genomic regions to predict and understand gene expression. (I) Inputs to the model include Hi-C maps for each chromosome, with the binned chromosomal regions corresponding to nodes in the graph, and the average ChIP-seq readings of six core histone marks in each region, which constitute the initial feature embedding of the nodes. (II) For nodes corresponding to regions containing a gene, the model performs repeated graph convolutions over the neighboring nodes to yield either a binarized class prediction of gene expression activity (either active or inactive) or a continuous, real-valued prediction of expression level. (III) Finally, explanations for the model's predictions for any gene-associated node can be obtained by calculating the importance scores for each of the features and the relative contributions of neighboring nodes. Therefore, the model provides biological insight into the pattern of histone marks and the genomic interactions that work together to predict gene expression. GC-MERGE, Graph Convolutional Model of Epigenetic Regulation of Gene Expression; HM, histone mark.

