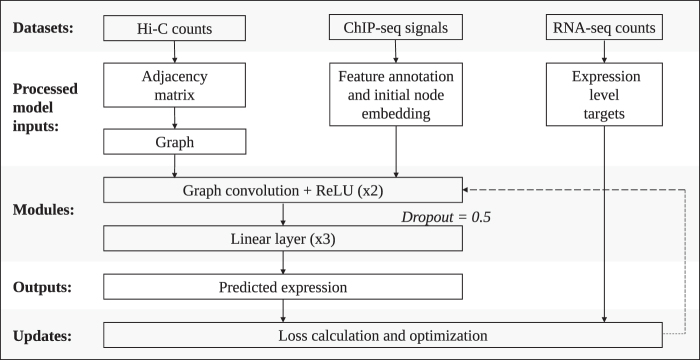
FIG. 2.
Overview of the GCN model architecture. The data sets used in our model are Hi-C maps, ChIP-seq signals, and RNA-seq counts. A binarized adjacency matrix () is produced from the Hi-C maps by subsampling from the Hi-C matrix. The nodes v in the graph are annotated with features from the ChIP-seq data sets (xv). Two graph convolutions, each followed by ReLU, are performed. The output from here is fed into a dropout layer (probability = 0.5), followed by a linear module that comprised three dense layers, in which ReLU follows the first two layers. For the classification model, the output is fed through a softmax layer, and then the argmax is taken to make the final prediction (yv). For the regression model, the final output represents the base-10 logarithm of the expression level (with a pseudocount of 1).

