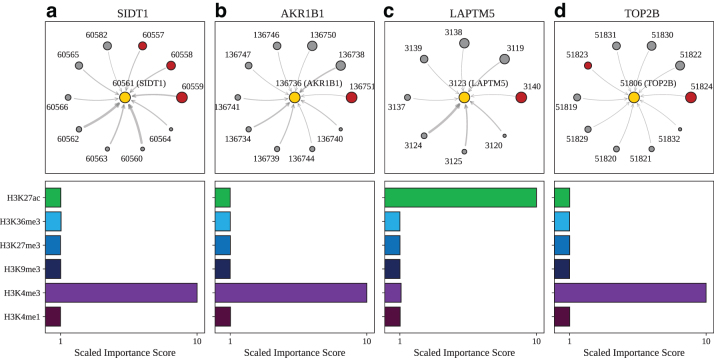
FIG. 5.
Model explanations for exemplar genes validated by promoter capture Hi-C. Top: For (a) SIDT1, designated as node 60561 (yellow circle), the subgraph of neighbor nodes is displayed. The size of each neighbor node correlates with its predictive importance as determined by GNNExplainer. Nodes in red denote regions corresponding to known enhancer regions regulating SIDT1 (Jung et al., 2019) (note that multiple interacting fragments can be assigned to each node, see Supplementary Table S3). All other nodes are displayed in gray. The thickness of each edge is inversely correlated with the genomic distance between each neighbor node and the central node, such that thicker edges indicate neighbor nodes that are closer in sequence space to the gene of interest. Nodes with importance scores corresponding to outliers have been removed for clarity. Bottom: The scaled feature importance scores for each of the six core histone marks used in this study are shown in the bar graph. Results also presented for (b) AKR1B1, (c) LAPTM5, and (d) TOP2B.

