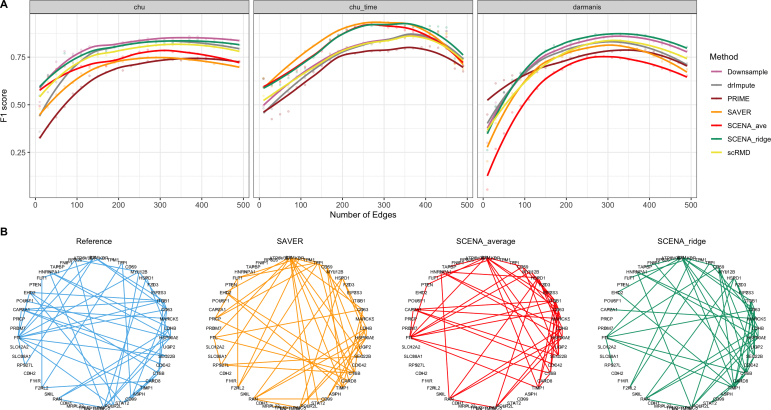
FIG. 4.
Genetic graph recovery. (A) F1 score (higher is better) quantifying the performance of methods at recovering the reference gene expression network of 50 most variable genes for various numbers of edges. SCENAridge exhibits strong performance for all data sets, whereas other methods' performance dramatically changes across different data sets. (B) Gene expression network of chu data, setting the number of edges to 50.

