
Figure 5: Interaction diagrams for APA-PLP (A) and APA (B).
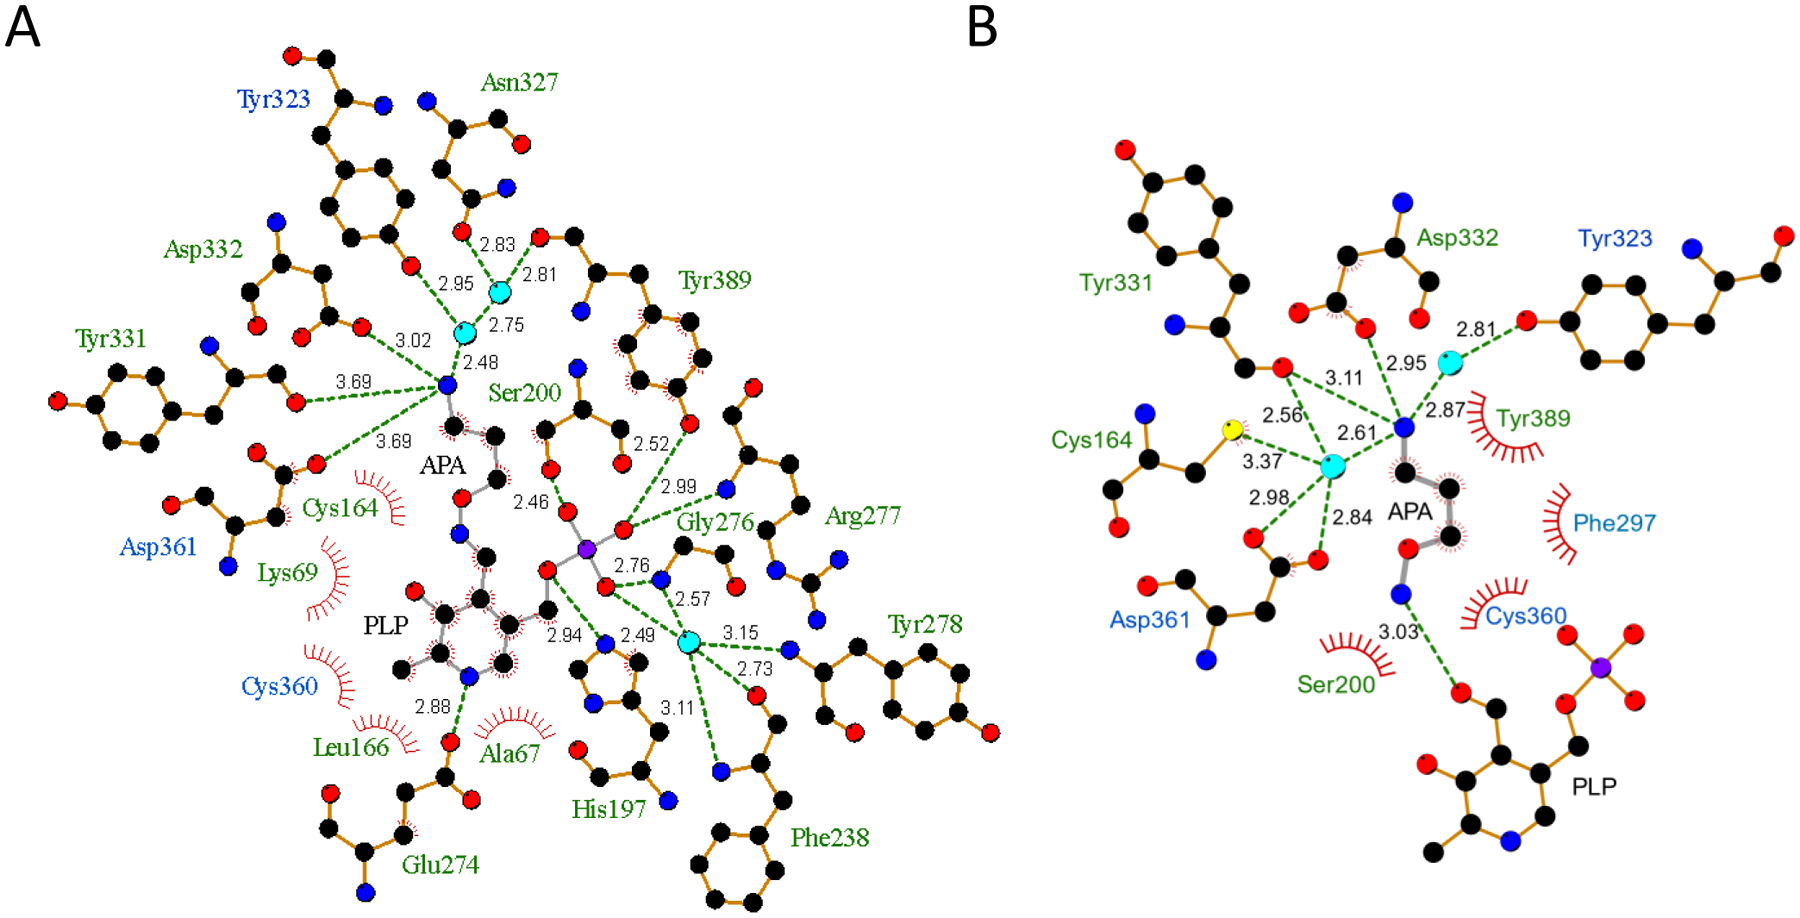
Diagrams were generated with LigPlot+. APA and APA-PLP are shown in grey stick representation, ODC residues that form hydrogen bonds are shown in orange stick representation, and structured water molecules as cyan spheres. Hydrogen bonds are shown as dashed lines with bond lengths labeled, and Van-der-Waals interactions as spoked arcs. Residues colored in green are from the same monomer as PLP and residues colored in blue are from the other monomer.