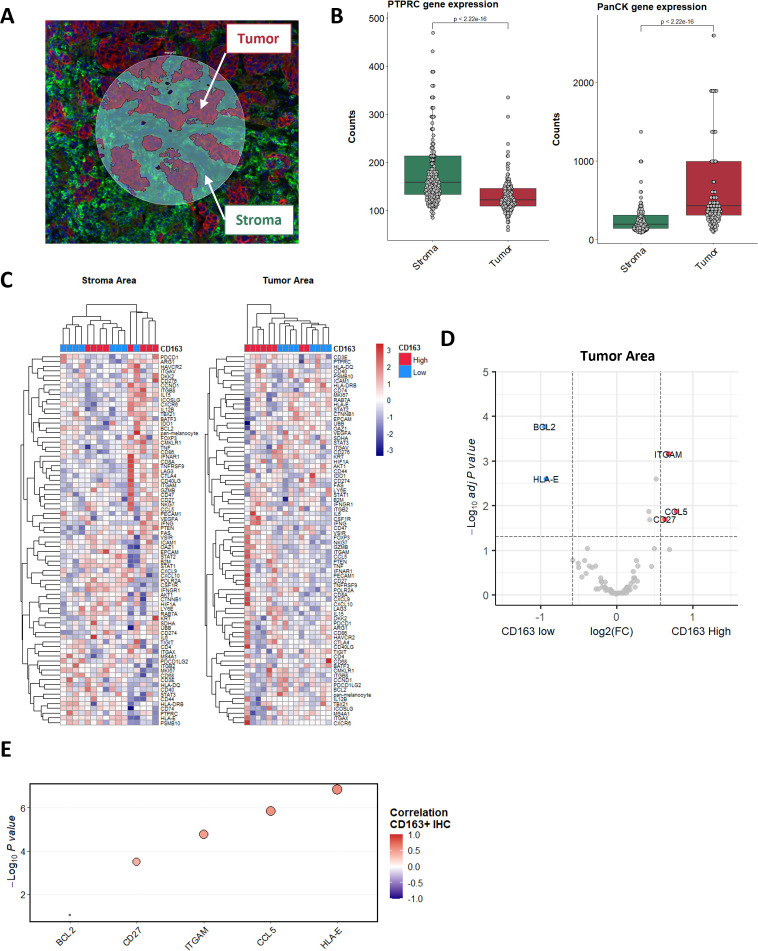
Figure 2.
Tumor expression of CCL5 induces CD163+ cell recruitment. (A) Tissue segmentation in tumor (red) and stroma (green) areas of illumination (AOI), performed on the GeoMX DSP platform. (B) Representation of CD45 (left) and PanCK (right) expression in the tumor and stroma AOIs. (C) Unsupervised clustering of tumor patient samples based on the averaged expression of the GeoMX Immune Pathways Panel probes in the tumor and stroma areas. Levels of CD163+ cell infiltration classified as high (red) and low (blue) are annotated. (D) Volcano plot representation of the gene differentially expressed by CD163+ high and low patients in their tumor areas. (E) Spearman correlation of the CD163+ cell density determined by IHC and the level of messenger RNA expression of indicated genes assessed by bulk RNA sequencing. DSP, Digital Spatial Profiler; IHC, immunohistochemistry.

