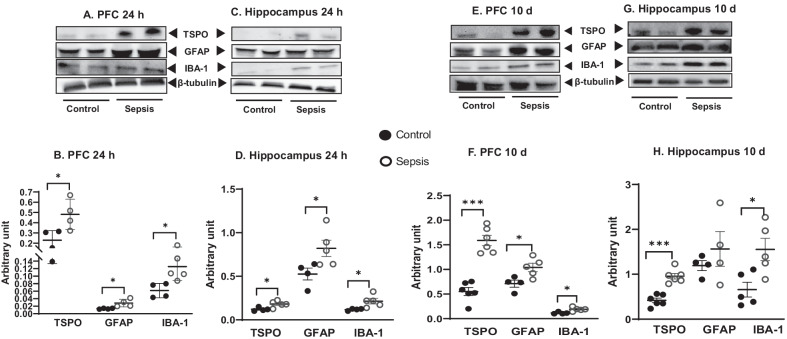
Fig. 4.
Upregulation of glial marker at 24 h A PFC and C Hippocampus; and 10 days E PFC and G Hippocampus after experimental sepsis induction in the Western blot analysis. Quantification of immunoblot data using the densitometric analysis of each protein was carried out using Image Lab™ software (Bio-Rad, California, USA). Representative immunoblots and quantification for 24 h, IBA-1, GFAP, and TSPO in the PFC B and hippocampus D. Representative immunoblots and quantification for 10 days, IBA-1, GFAP, and TSPO in the PFC F, and hippocampus H. The values for all protein levels were normalized to those of β-tubulin. The results are expressed as the mean ± SEM for n = 4–6 rats. *p < 0.05 and ***p < 0.001 compared to controls

