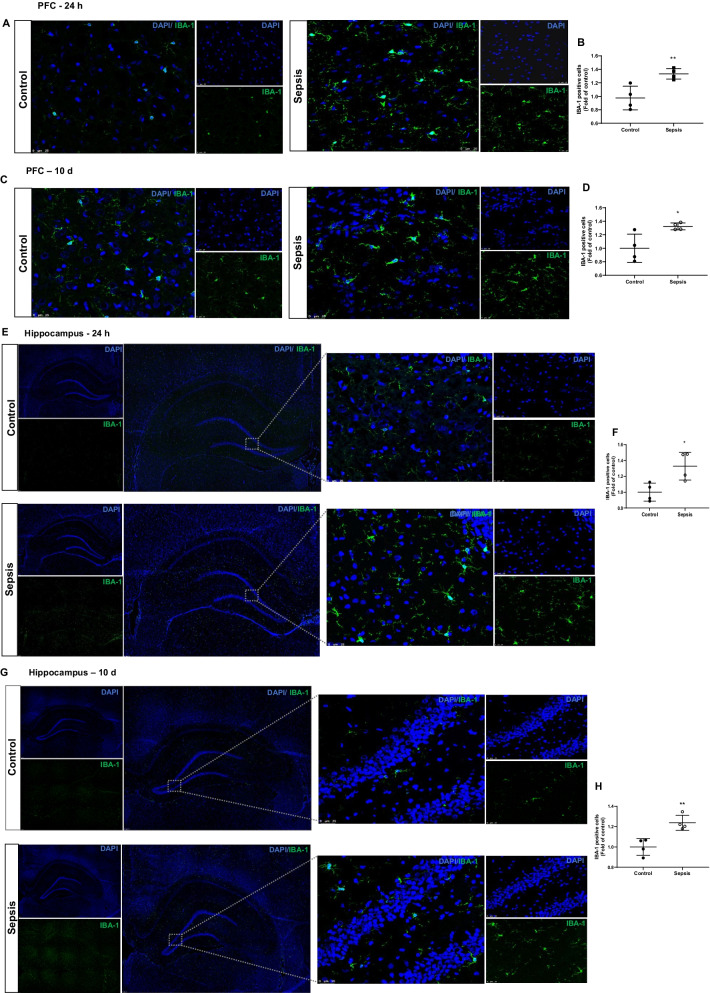
Fig. 5.
Increased microglial positive cells at 24 h and 10 days after experimental sepsis induction in PFC and hippocampus. Representative microscopic field images (magnification, × 400) immunostained with IBA-1 antibodies in the PFC A 24 h, B quantification of 24 h, **p < 0.01, C 10 days, D quantification of 10 days, *p < 0.05, after experimental sepsis induction. Representative microscopic field images (magnification, × 100 and × 400) immunostained with IBA-1 antibodies in the hippocampus E 24 h, F Quantification of 24 h, *p < 0.05, G 10 days, H Quantification of 10 days, **p < 0.01, after experimental sepsis induction. The results are expressed as the mean ± SEM for n = 4 rats

