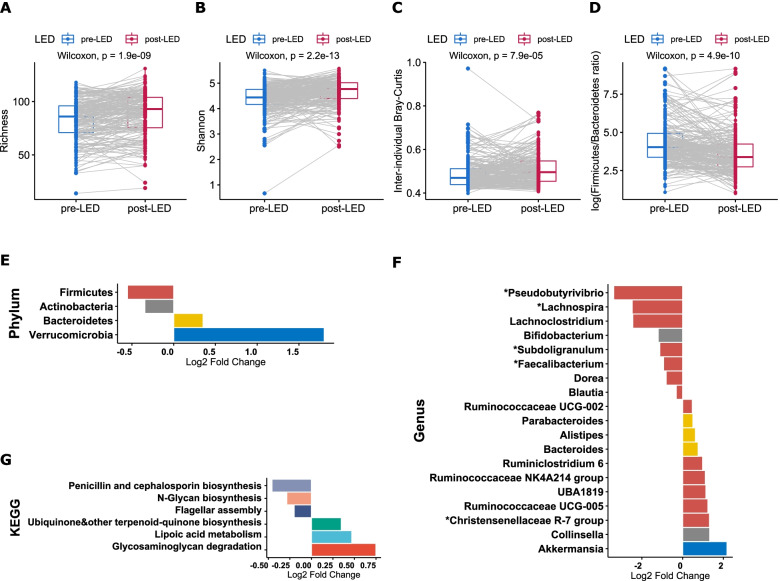
Fig. 3.
The LED intervention reshapes the overall microbiota structure, alters relative abundances of individual bacterial taxa and predicted functions. Pre- and post-LED A richness, B diversity within samples (Shannon index), C average dissimilarities (beta diversity) estimated by Bray-Curtis distances between participants, and D Firmicutes to Bacteroidetes ratio. Differentially abundant E phyla, F genera (coloured by respective phyla) and G KEGG modules following the LED ranked by log-fold change are visualized by divergent bar plots. Only the 15 most abundant genera and KEGG modules are shown in F and G. Log2 fold change is calculated as post-LED/pre-LED; only significant results (FDR-P < 0.05) are plotted. The genera known to be able to produce butyrate are marked with an asterisk (*) in I

