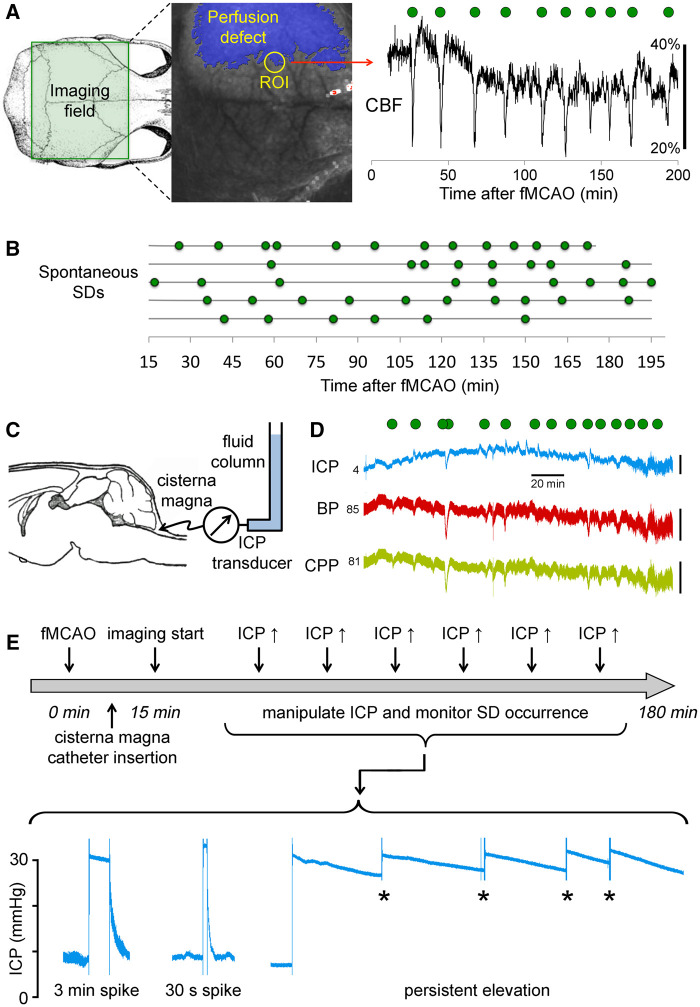
Figure 1.
Experimental design and protocols. (A) Full-field LSF was used to image CBF changes over the dorsal cortex during fMCAO. Imaging field (green rectangle) was positioned to encompass both hemispheres. A representative speckle contrast image is also shown superimposed with the perfusion defect (blue shaded area) with ≤30% residual CBF, calculated using the average correlation time values from the contralateral hemisphere to serve as baseline. Perfusion changes (shown in artificial units as a marker of SD) in a typical penumbral region of interest (ROI) detected the characteristic hypoperfusion transients associated with peri-infarct depolarizations (green symbols). (B) Spontaneous SDs occurring in random fashion throughout 3 h of imaging in control mice (n = 5). Each horizontal line is one animal. Green symbols indicate the timing of SD occurrence. (C) ICP was monitored and modulated via a cisterna magna catheter connected to a fluid column. (D) A typical ICP tracing is shown recorded simultaneously with blood pressure (BP) to calculate the CPP (CPP = BP − ICP). ICP remained <10 mmHg in control animals with fMCAO for the duration of recordings (∼3 h after stroke onset), and did not show a consistent relationship to SD occurrence (green circles). Vertical scale bars indicate 5 mmHg for ICP, 50 mmHg for BP and CPP. The ICP, BP and CPP values at the onset of the tracings are also shown in mmHg. (E) Experimental protocol and timeline. After fMCAO (time 0), cisterna magna was quickly accessed and laser speckle imaging started within 15 min to obtain a baseline. Then six ICP spikes were induced at one every 12 min for 3 min or 30 s, at an ICP level of 20, 25 or 30 mmHg. In a separate group ICP was persistently kept high at 20 or 30 mmHg; slow decline was periodically corrected (asterisk).

