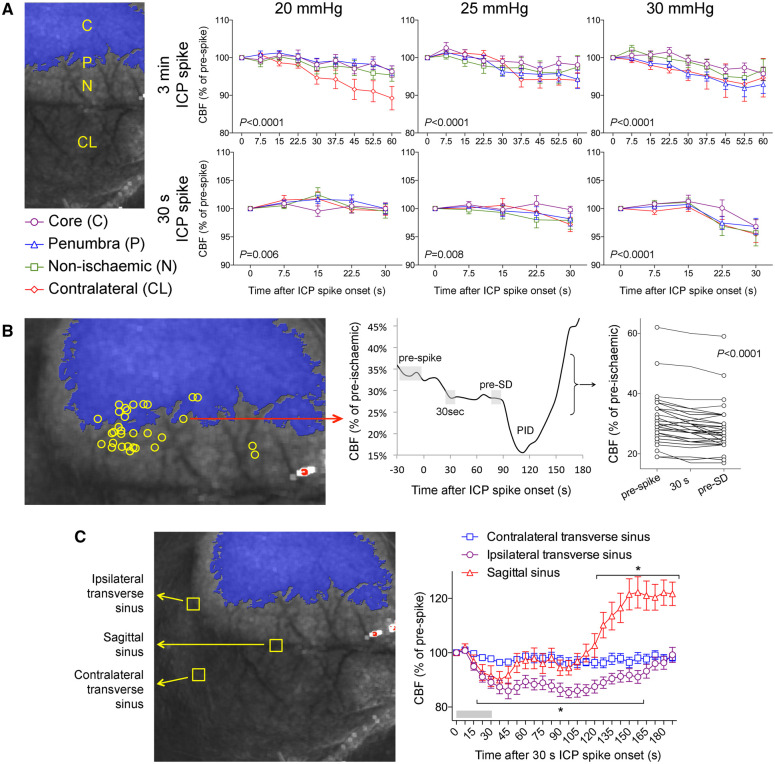
Figure 4.
Effects of ICP elevations on CBF in relation to SDs. (A) CBF changes (relative to prespike baseline) in ischaemic core (C), penumbra (P), non-ischaemic cortex (N) and contralateral cortex (CL) regions of interest shown as a function of time after spike onset for 3 min (top row) and 30 s (bottom row) ICP spikes at different ICP levels (two-way ANOVA for repeated measures). (B) CBF changes at the origins of spike-induced SDs within the field of view (left) were calculated by measuring (middle panel) the grey shaded areas representing the prespike baseline, minimum CBF during the spike (30 s), and immediately before the SD (pre-SD), and expressed as a percentage of pre-ischaemic baseline (right). SDs originated from foci with a range of residual CBF levels that were usually <40% of pre-ischaemic baseline. There was a statistically significant drop in CBF during ICP spike, which persisted until an SD occurred (one-way ANOVA for repeated measures). (C) CBF changes in ipsilateral and contralateral transverse and sagittal venous sinuses during and after a 30-s, 30 mmHg ICP spike; 3-min ICP spikes caused similar changes (not shown). *P < 0.005 versus time 0 (one-way ANOVA for repeated measures).

