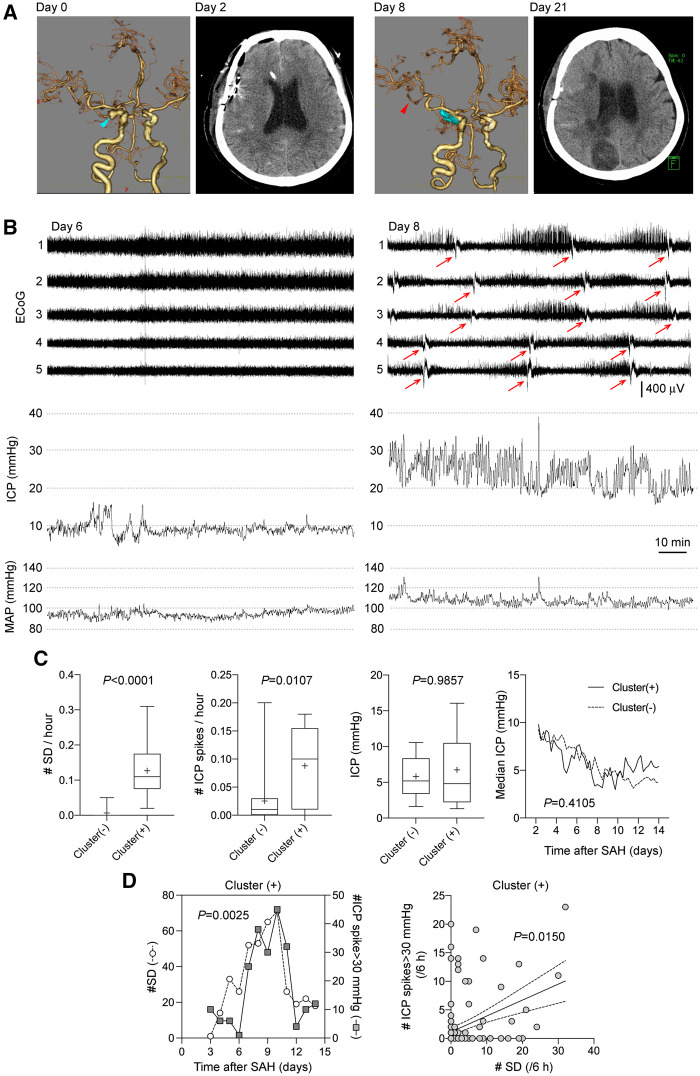
Figure 7.
Higher frequency of ICP spikes (≥30 mmHg) are associated with SD clusters in patients with aneurysmal SAH. (A) Representative CT and CT angiography images from the same patient. CT angiography on admission reveals right internal carotid-posterior communicating artery aneurysm (blue arrow). On Day 8, CT angiography shows vasospasm on the M2 portion of right MCA (black arrow). CT on Day 21 shows cerebral infarction in the right hemisphere. (B) Representative ECoG and ICP tracings in a patient who developed SD clusters. The patient was a 64-year-old female with SAH due to ruptured right internal carotid-posterior communicating artery aneurysm that was clipped on Day 0. Patient remained stable until Day 8 when level of consciousness declined. On Day 6, ICP was <20 mmHg and there was no SD (A, left). On Day 8, numerous ICP spikes were observed during a period of SD clusters (arrow) (A, right). (C) From left to right, the frequency of SDs and ICP spikes, and the average ICP values throughout the entire recordings (Mann-Whitney test), and the time course of median ICP values measured in 6-h epochs, are shown in cluster (−) and (+) patients (mixed effects model). (D) Left: The temporal association between the daily number of SDs and the number of ICP spikes in cluster (+) cohort is shown between 3 and 14 days after SAH. Number of ICP spikes and SDs were significantly correlated (Pearson R = 0.79, P = 0.0025; n = 10 patients). Right: Temporal association between the number of SDs and ICP spikes when analysed in 6-h bins in each patient shown as an xy plot (Spearman R = 0.21, P = 0.0150; n = 10 patients). Each symbol represents a 6-h period in one patient.

