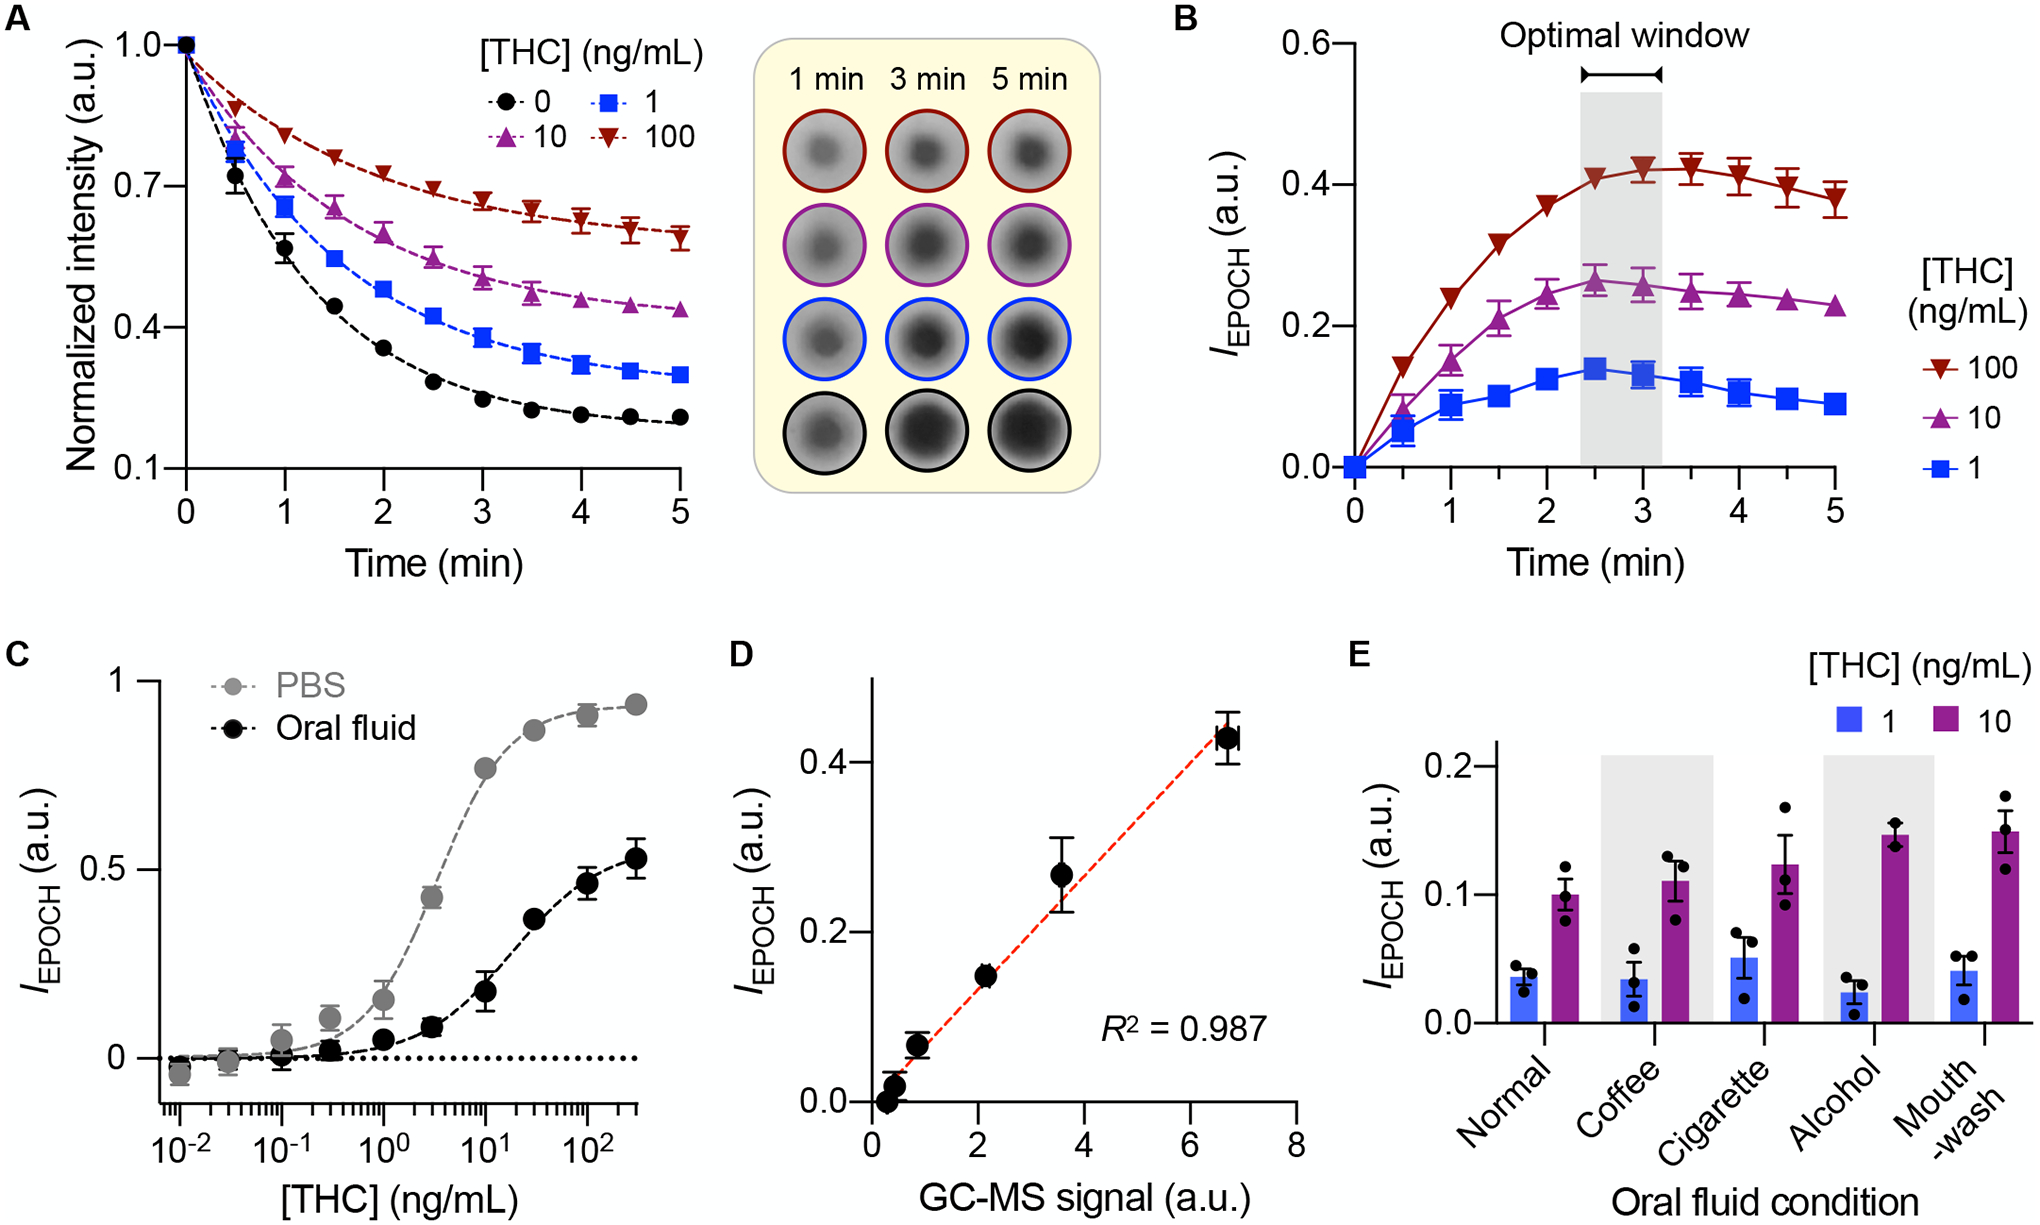
Fig. 4. EPOCH assay characterization.

(A) Temporal signal changes measured at different THC concentrations. The assay followed first-order Langmuir kinetics. The inset (right) shows raw images of AuNPAb binging spots. (B) Net signal differences between THC-positive and control (no THC) samples. (C) EPOCH measurements with THC spiked in phosphate-buffered saline (PBS) buffer or oral fluid. The limits of detection were 0.12 (in PBS) and 0.17 (in oral fluid) ng/mL, and the dynamic ranges spanned about 4 orders of magnitude. (D) EPOCH results were compared with gas chromatography-mass spectrometry (GC-MS) and found to match well (R2 = 0.987). (E) EPOCH measurements with oral fluid samples collected after activities that affect the oral cavity environment: consuming coffee, smoking cigarettes, drinking beer, and rinsing with mouthwash. Even at [THC] = 1 ng/mL, the signal was significantly higher than background in all oral fluid types (P = 0.0005, one-sided t-test). All data were obtained from technical triplicate measurements and are displayed as mean ± SD.
