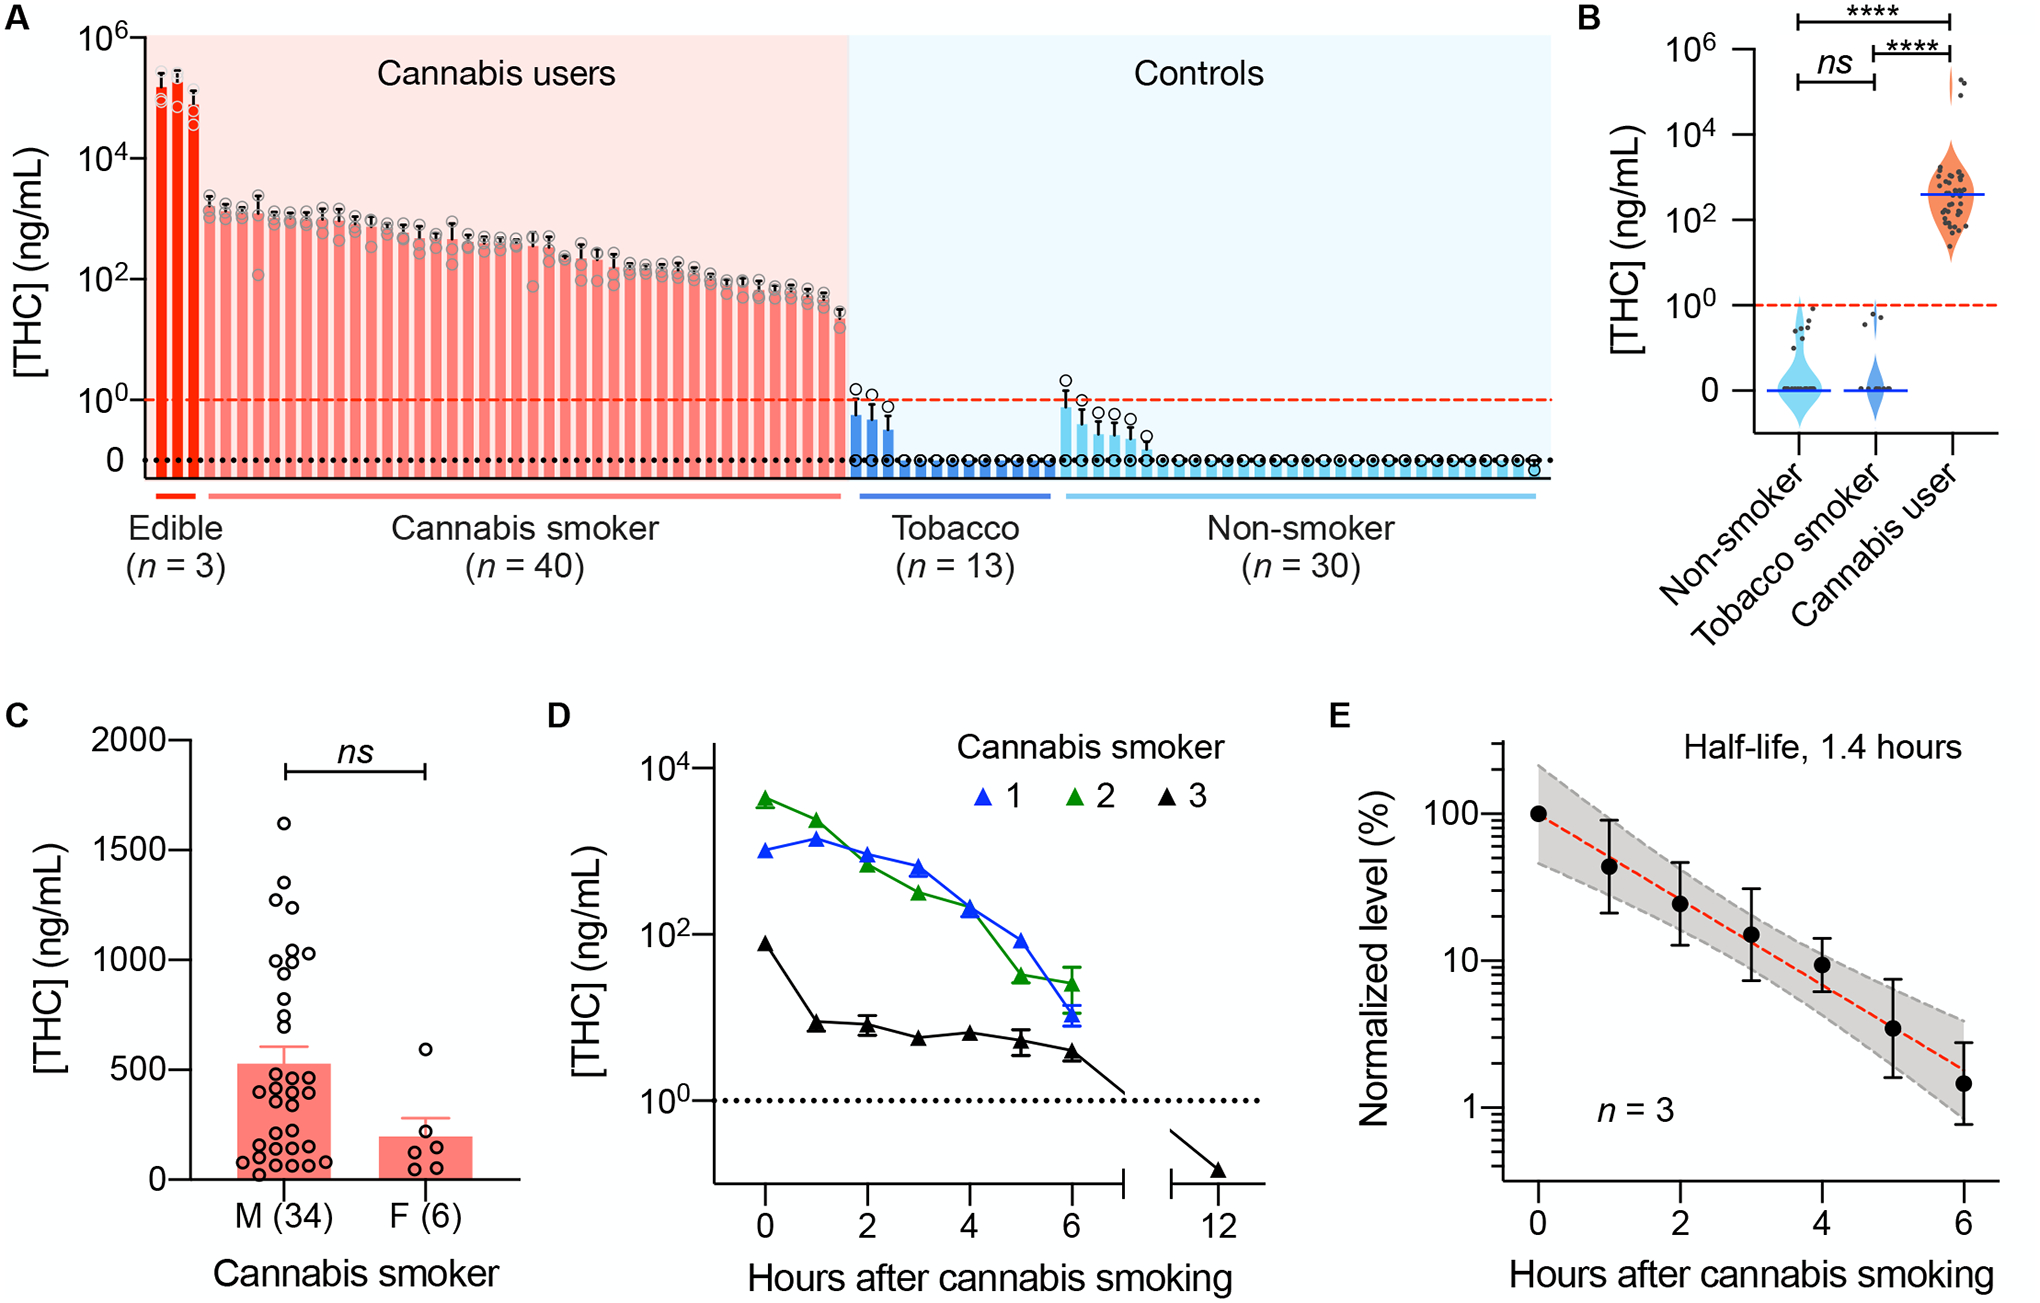
Fig. 5. In-field EPOCH tests of oral fluid samples.

(A) The waterfall plot shows THC concentrations in oral fluid samples from 43 cannabis users (40 cannabis smokers and three THC-infused jelly consumers) and 43 volunteers with no history of cannabis use (13 tobacco smokers and 30 non-smokers). All cannabis-user samples showed high THC concentration above the regulatory guideline (1 ng/mL [THC]). Data are displayed as mean ± SD from triplicate measurements. (B) The oral THC concentration was significantly higher in cannabis users than in controls (****P < 0.001, Dunn’s multiple comparison test). ns, non-significant. (C) Between male (M) and female (F) cannabis smokers, the oral THC concentrations showed no significant difference (P = 0.086; two-sided t-test). Each data point represents a mean value from triplicate measurements. (D) Oral fluid samples from three cannabis users were serially monitored. THC concentrations decreased over time and were expected to fall below the DRUID threshold (dotted line) within 12 hours of cannabis smoking. (E) Temporal changes in THC concentrations displayed a single-phase exponential decay (R2 = 0.995) with a half-life of 1.4 hours. The shaded area indicates a 95% confidence band. THC concentrations were normalized against the initial value for each user. Data from three users are displayed as mean ± SD.
