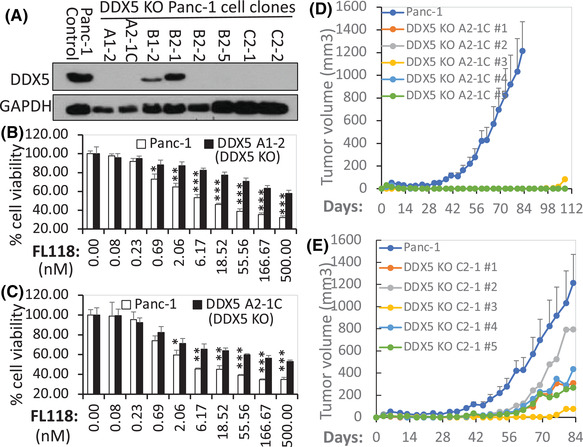
FIGURE 8.

(A) Detection of DDX5 knockout (KO) cell clones. The expression profile of DDX5 in various Panc‐1 individual cell clones in parallel with the parental Panc‐1 control cells analysed by western blots is shown. GAPDH was used as the internal control. (B), (C) DDX5 KO in PDAC Panc‐1 cells results in FL118 loss of function to inhibit cell growth/viability: DDX5 KO Panc‐1 clone A1‐2 cells (B) and DDX5 KO Panc‐1 clone A2‐1C cells (C) in parallel with control Panc‐1 cells (B, C) were treated with and without FL118 as shown. Cell viability was determined by MTT assay 72 h after with and without FL118 treatment. Each bar is the mean ± SD derived from three assays. *p < .05; **p < .01; ***p < .001. (D), (E) In vivo tumour formation and growth of DDX5 KO Panc‐1 cells and corresponding control cells are shown: DDX5 KO Panc‐1 clone A2‐1C cells (2 × 10⁶, D) and DDX5 KO Panc‐1 clone C2‐1 cells (2 × 10⁶, E) in parallel with the parental Panc‐1 control cells (2 × 10⁶, D, E) were subcutaneously injected into each site at the flank area of SCID mice. Tumour growth was monitored over time. The parental Panc‐1 control cell tumour growth curve at each time point is the mean ± SD from five tumours from five mice. The DDX5 KO cell tumour growth curves are the individual tumour growth curves derived from five tumours from five mice.
