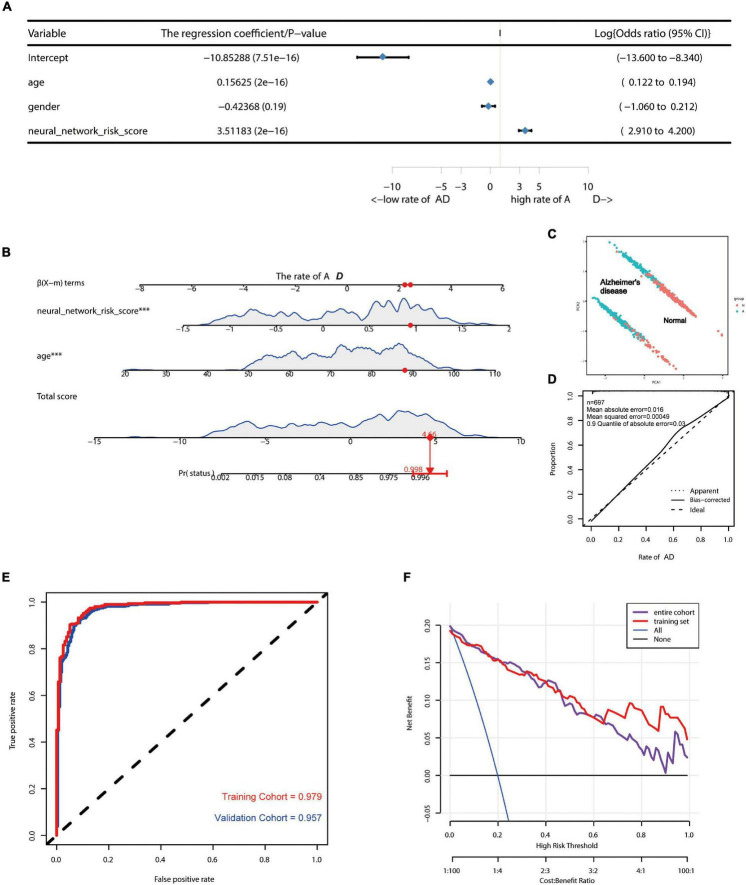
FIGURE 3.
Construction of AD risk nomogram model based on neural network model. (A) A forest plot for multifactor logistical analysis based on age, gender, and neural network risk score. (B) A nomogram prediction model was constructed using neural network risk score and age. (C) PCA suggests that the model is better able to distinguish AD from normal patients. (D) The calibration curve of this nomogram prediction model after including a sample of 697 cases. (E) ROC curves of the AD risk nomogram prediction model constructed based on the neural network model for the training group (AUC = 0.979) and the test group (AUC = 0.957). (F) DCA curves of this nomogram prediction model.

