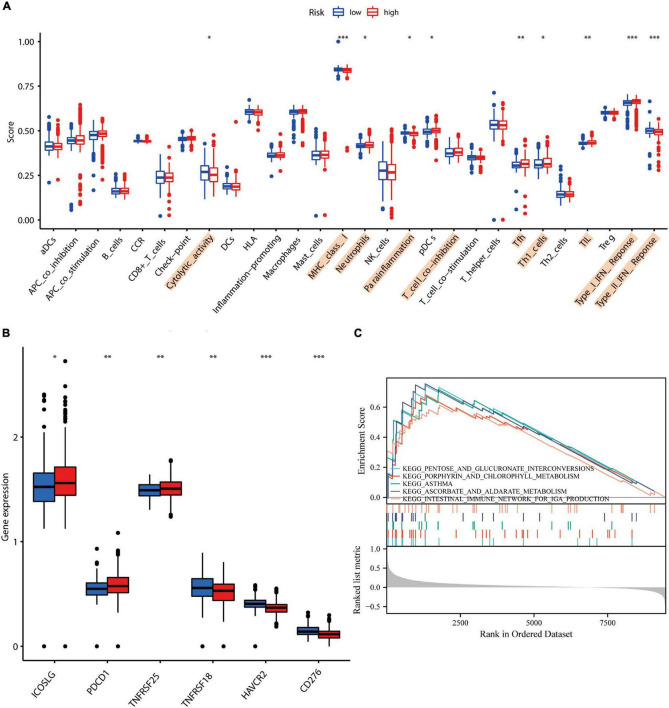
FIGURE 4.
Correlation study of AD risk score scores with local immune characteristics. (A) Immune cell infiltration analysis based on ssGSEA. (B) Correlation of high and low AD risk scores with immune checkpoints. (C) GSEA enrichment analysis based on AD scores. * represents p-value < 0.05, ** represents p-value < 0.01, and *** represents p-value < 0.001.

