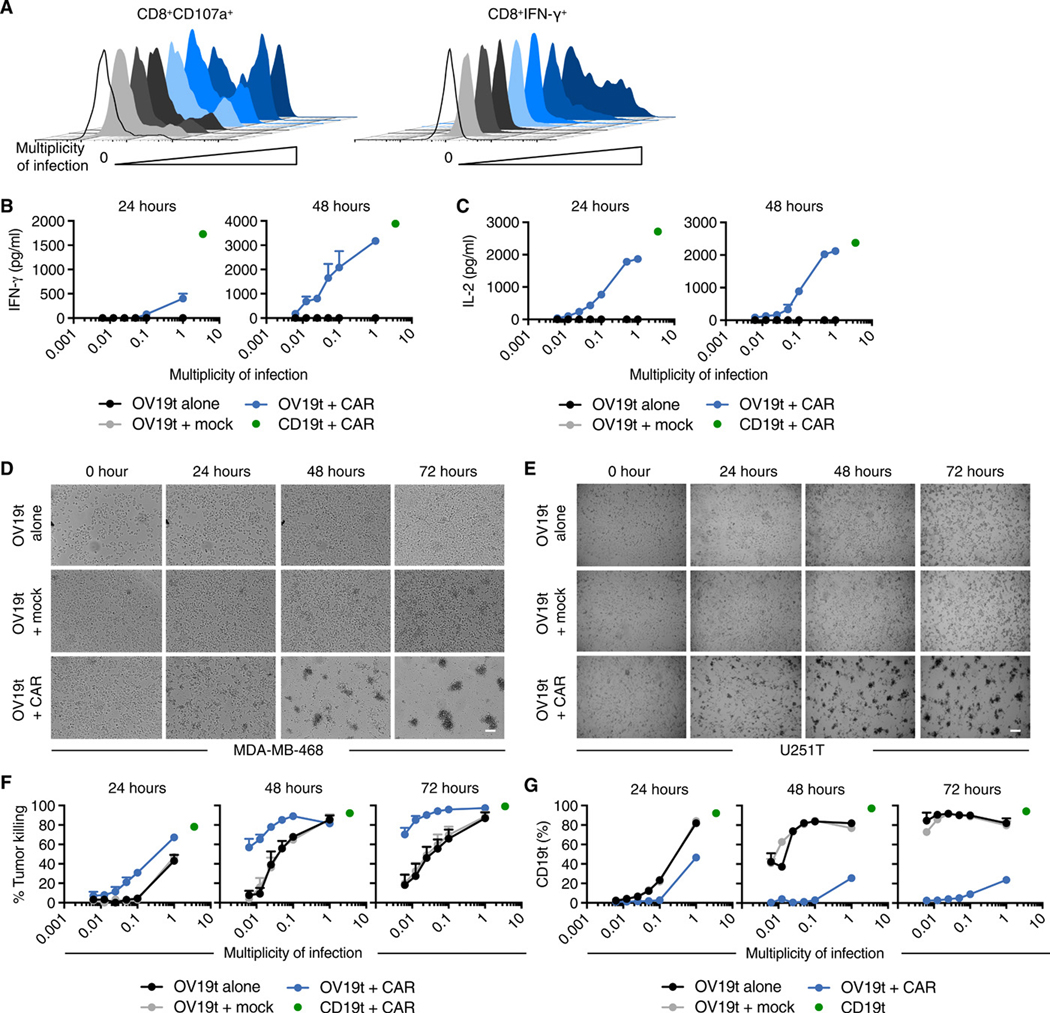
Fig. 2. OV19t introduces CD19t on tumor cells, which directs activation and cytotoxicity of CD19-CAR T cells in vitro.
(A) Representative flow cytometric analysis showing abundance of cell surface CD107a on and intracellular IFNγ in CD8+CAR+ T cells following 16-h coculture with MDA-MB-468 tumor cells in the presence or absence of the indicated MOI of OV19t. Ratio of effector CD19-CAR T cell to tumor cell was 1:1. Data are from one of two independent experiments. (B) IFNγ and (C) IL-2 production measured by ELISA in supernatants collected from cocultures in the presence or absence of OV19t at indicated MOIs for 24 and 48 h. Values for MDA-MB-468 cells stably expressing CD19t cocultured with CD19-CAR T cells (CD19t + CAR, green dot) are indicated by a single data point on each graph. Data presented are from technical duplicates and shown as mean + SD. (D, E) Tumor killing assay of MDA-MB-468 (D) and U251T (E) cells visualized by phase-contrast microscopy. Representative images are shown. Scale bars, 200 μm. (F) Quantification of MDA-MB-468 cell killing assessed by flow cytometry. MDA-MB-468 tumor cells were cocultured with untransduced T cells (Mock) or CD19-CAR T cells for 24, 48, or 72 h in the presence of the indicated MOIs of OV19t. Values for MDA-MB-468 cells stably expressing CD19t cocultured with CD19-CAR T cells (CD19t +CAR, green dot) are indicated by a single data point on each graph. Data presented are from duplicate wells from two experiments and shown as mean + SEM. (G) Percent of MDA-MB-468 cells positive for CD19t in killing assay described in F. Values for MDA-MB-468 cells stably expressing CD19t cultured without CD19-CAR T cells (CD19t, green dot) are indicated by a single data point on each graph. Data presented are from duplicate wells and shown as mean + SEM.

