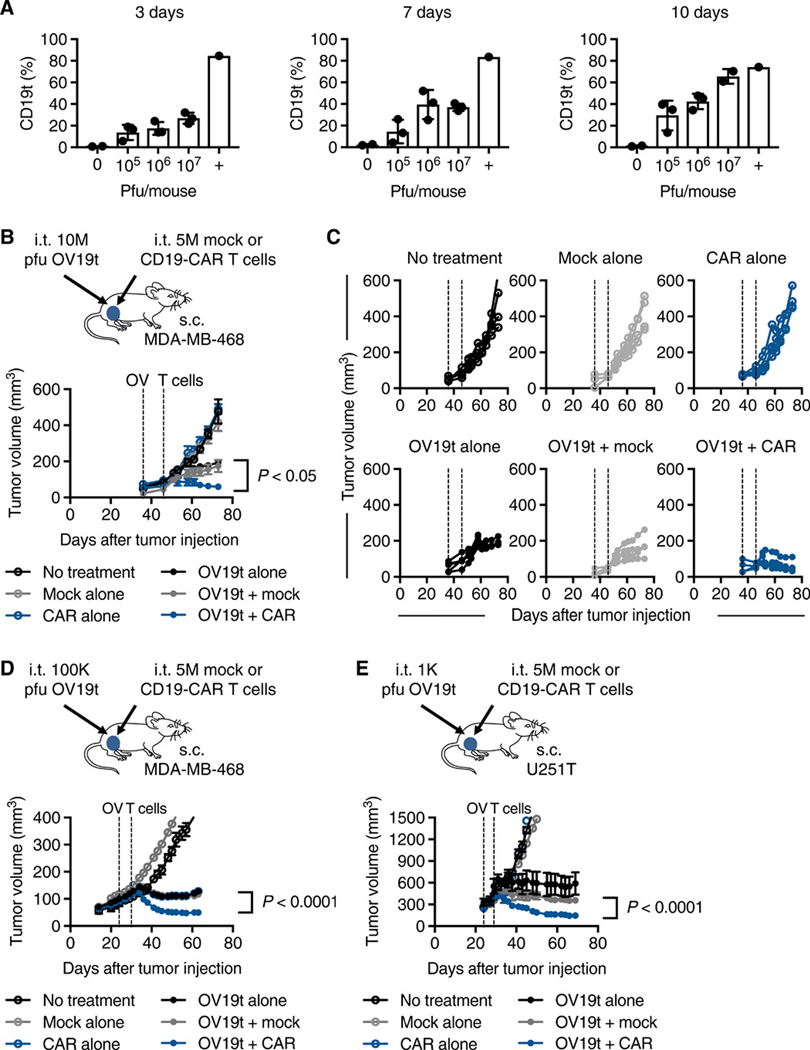
Fig. 3. Anti-tumor efficacy of combination therapy of OV19t and CD19-CAR T cells in human xenograft tumor models.
(A) Percent of CD19t-positive tumors cells. Mice were engrafted with subcutaneous MDA-MB-468 tumors (5 × 10⁶ cells) and at day 24, mice were intratumorally injected with 0 (n = 2), 105, 106, or 107 (n = 3) plaque-forming units (pfu) of OV19t per mouse, which were harvested at day 3, 7, or 10 after treatment with OV19t. Percent cells positive for CD19t was quantified by flow cytometry. The positive control (+) represents MDA-MB-468 tumors stably expressing CD19t through lentiviral-mediated transduction prior to engraftment. (B) Top: Schematic of MDA-MB-468 tumor-bearing mice treated with OV19t and CD19-CAR T cells. NSG mice were injected subcutaneously with MDA-MB-468 (5 × 10⁶ cells) on day 0, and tumors were injected with OV19t (107 pfu, 10M) on day 36. On day 46, tumors were injected with either untransduced T cells (Mock) or CD19-CAR T cells (CAR, 5 × 10⁶ cells). Bottom: Tumor volumes are shown as mean ± SEM (n ≥ 4 per group). (C) Tumor volumes for each mouse in each treatment group are shown for mice described in B. Dashed lines indicate OV and T cell injections. All data above are representative of two independent experiments. (D) Top: Schematic of MDA-MB-468 tumor-bearing mice treated with OV19t and CD19-CAR T cells. Experimental paradigm is the same as in B except tumor-bearing mice received intratumoral injections of OV19t (105 pfu, 100K) on day 24 and of either Mock T cells or CD19-CAR T cells (5 × 10⁶ cells) on day 32. Bottom: Tumor volumes are shown as mean ± SEM (n ≥ 4 per group). (E) Top: Schematic of U251T tumor-bearing mice treated with OV19t and CD19-CAR T cells (top). NSG mice were injected subcutaneously with U251T (5 × 10⁶ cells) tumors on day 0, and tumors were injected with OV19t (103 pfu, 1K) on day 24. On day 29, tumors were injected with either Mock or CD19-CAR T cells (5 × 10⁶ cells). Bottom: Tumor volumes are shown as mean ± SEM (n ≥ 3 per group). P values indicate differences between OV19t + Mock and OV19t + CAR and were determined by unpaired Student’s t test. s.c., subcutaneous; i. t., intratumoral.

