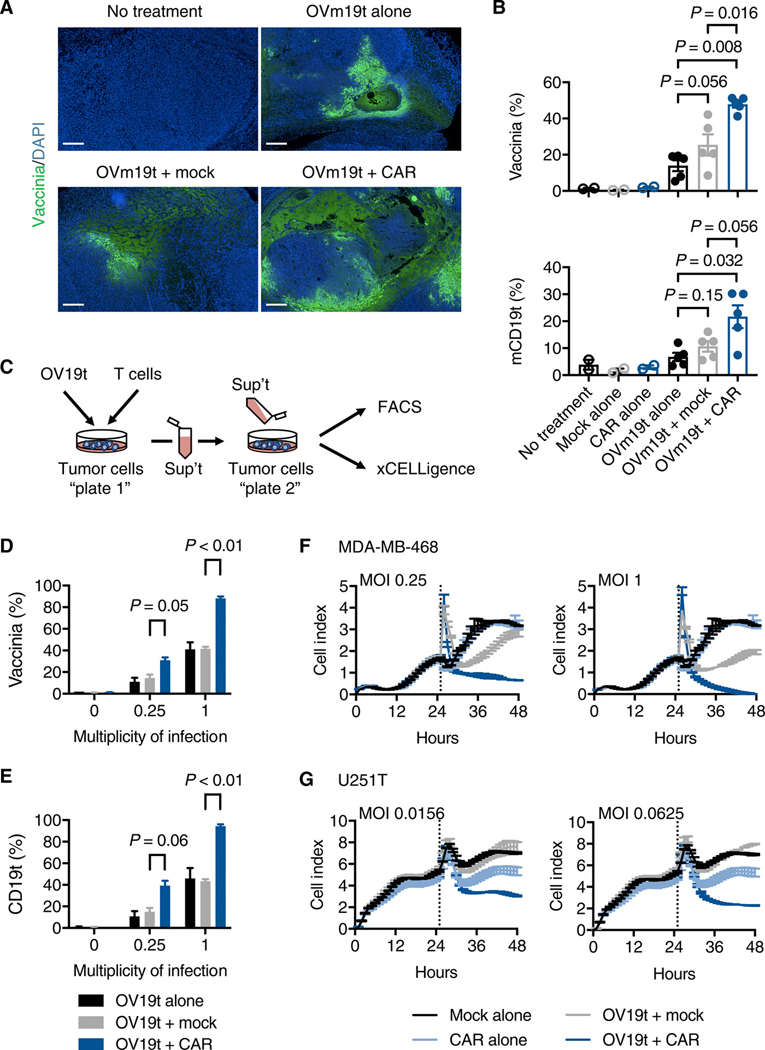
Fig. 5. CD19-CAR T cell-mediated tumor killing promotes the viral particle release and infection of tumor cells.
(A) Histology showing vaccinia virus in MC38 tumors harvested from mice with no treatment or treatment with OVm19t alone, OVm19t + Mock T cells, and OVm19t + mCD19-CAR T cells. T cell treatment was 2 days after OVm19t injection. Tumors were harvested and stained for vaccinia virus (green) 4 days after OVm19t alone or 2 days after T cell treatments. Scale bars, 500 μm. (B) Quantification of percent cells positive for vaccinia and mCD19t in subcutaneous tumors from mice receiving the indicated treatments. Mice were injected subcutaneously MC38 tumors (5 × 10⁵ cells) on day 0. On days 14 and 16 mice were intratumorally injected with OVm19t (5 × 10⁷) pfu per mouse. On day 18 mice were treated intravenously with Mock T cells or mCD19-CAR T cells. Tumors were harvested 5 days after OVm19t or 3 days after T cell treatments. Cells were analyzed by flow cytometry. n = 2 – 5 per group. Statistical analysis using unpaired Student’s t-test. (C) Schematic of experiment assessing viral release from MDA-MB-468 or U251T cells exposed to OV19t and Mock T cells or CD19-CAR T cells. In Plate 1, OV19t at varying MOIs were added to tumor cells for an initial 3 h incubation. Virus was washed off, and cells were incubated for an additional 4 h prior to adding Mock T cells or CD19-CAR T cells for 18 h. Supernatants were collected and added to freshly plated tumor cells (Plate 2) and incubated for 18 h. (D, E) Percent of cells positive for vaccinia (D) and CD19 (E) from Plate 2 was determined by flow cytometry. Data are shown as mean ± SEM from one experiment. Statistical analysis using unpaired Student’s t-test. (F, G) Viable cells in Plate 2 receiving supernatants from Plate 1 cells exposed to the indicated MOI of OV19t. MDA-MB-468 (F) or U251T (G) cells were cultured for 24 h and then medium was replaced (dotted line) with supernatant from Plate 1 cells exposed to the indicated conditions. Viable cells were calculated as “cell index” using the xCELLigence RTCA system. Data are shown as mean ± SEM from one of two independent experiments.

