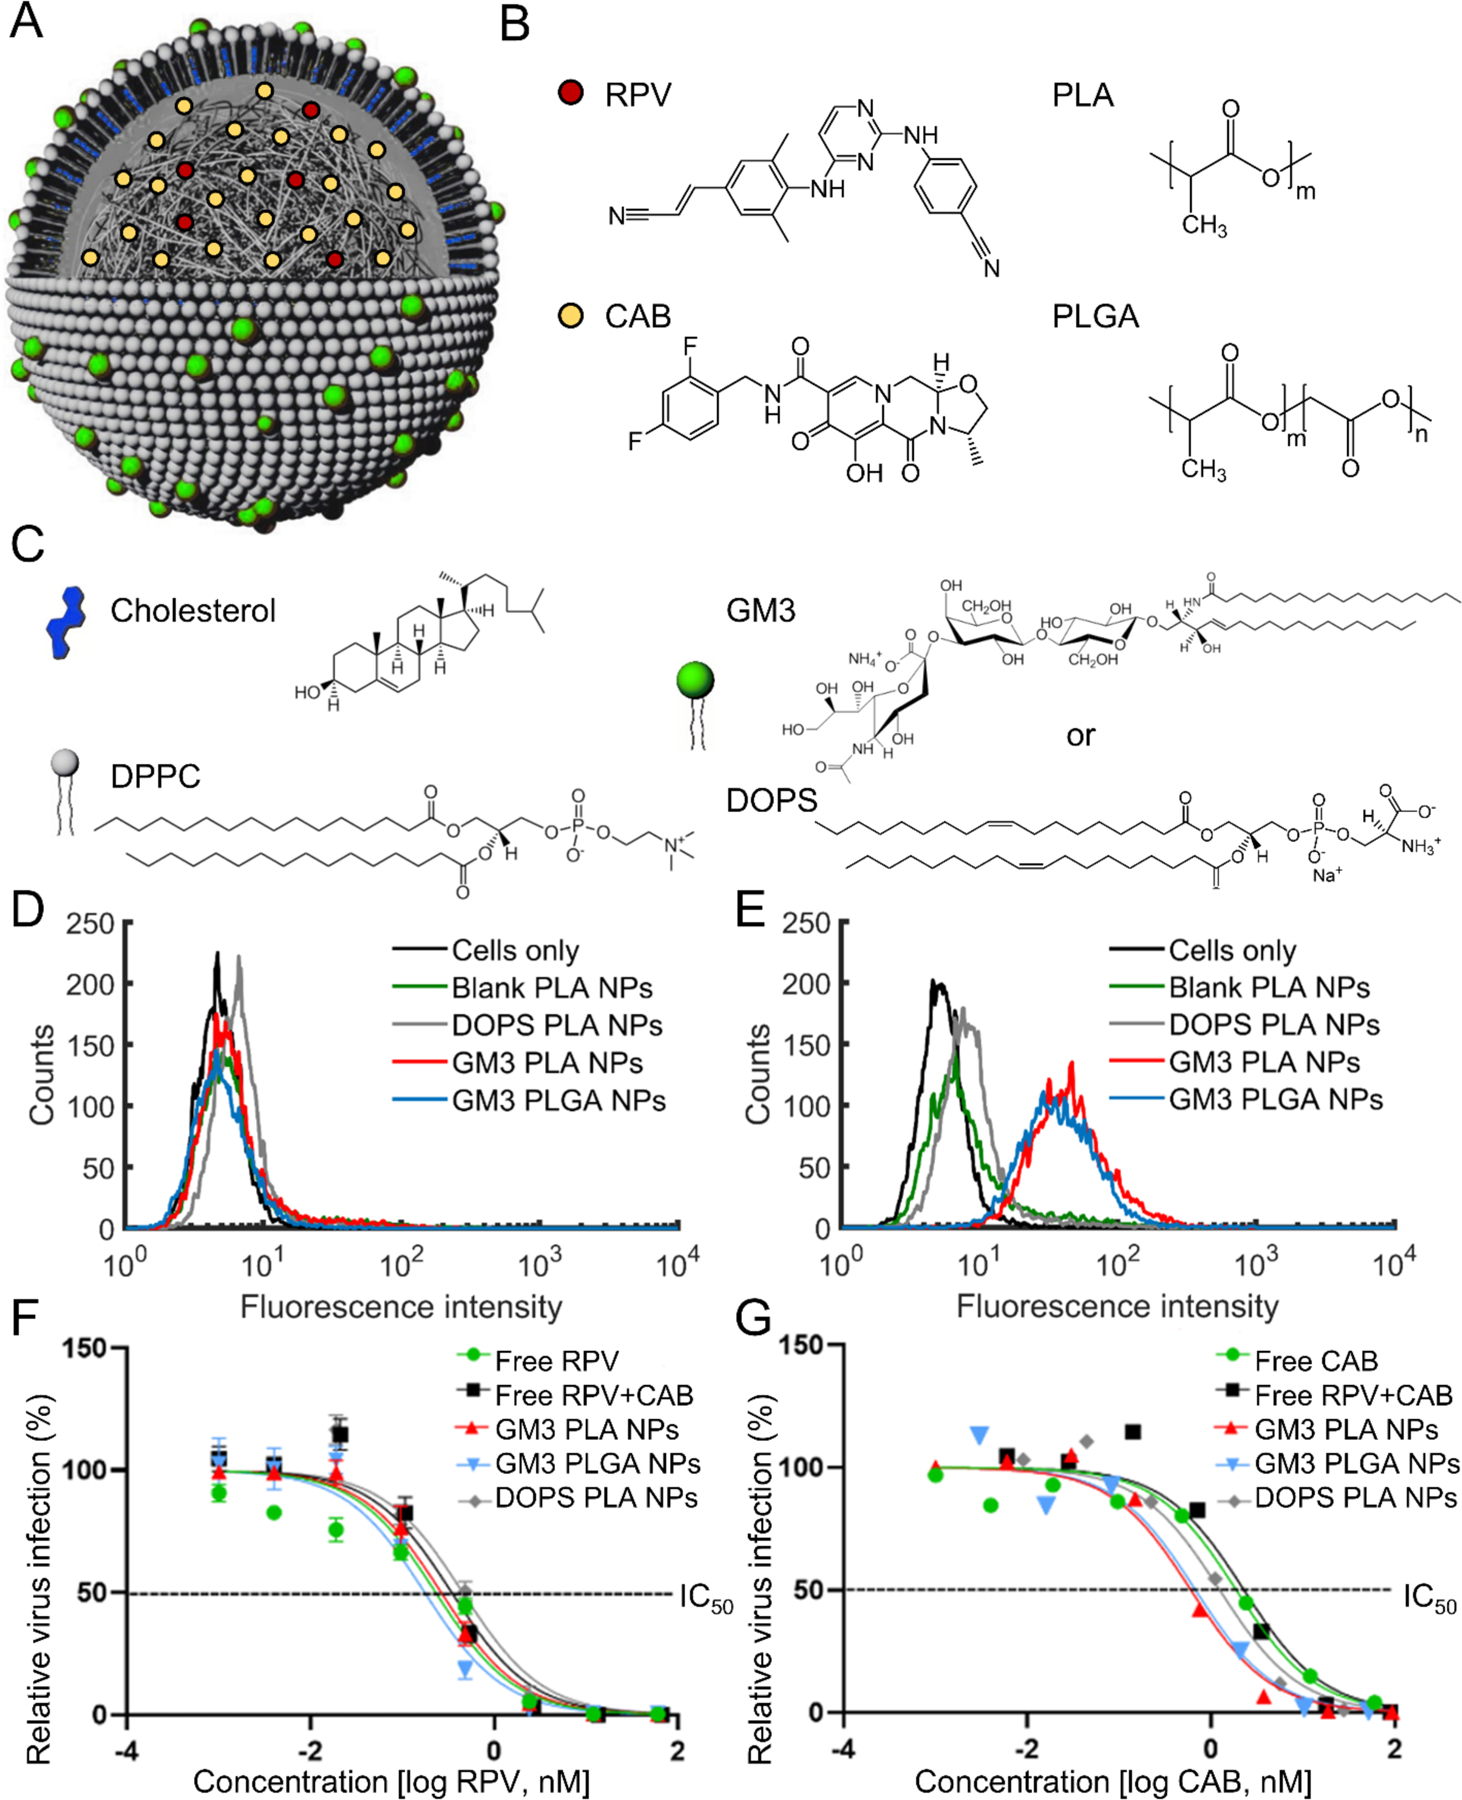
Figure 1.

Structure, composition, and potency of ARV-loaded lipid-coated polymer NPs. A) Scheme of RPV and CAB loaded lipid-coated polymer NP structure. A lipid monolayer (“membrane”) around the NP core was formed due to hydrophobic interactions between NP polymer core and hydrocarbon chains of the lipids. The NP scheme in a is adapted from ref 24, Wiley-VCH. B) Chemical structure of the polymers in the NP core (PLA and PLGA) and drug molecules (RPV and CAB). C) Chemical structure of membrane components (DPPC, cholesterol, and GM3 or DOPS). D-E) Histograms of fluorescence intensities obtained after incubating blank PLA (with 60 mol% DPPC and 40 mol% cholesterol in the membrane but no GM3 or DOPS), DOPS PLA, GM3 PLA, or GM3 PLGA NPs for 10 min at 37 °C with THP-1 (D) or CD169+ THP-1 monocytes (E). F-G) Dose response curves of GM3 PLA NPs, DOPS PLA NPs, and GM3 PLGA NPs, and free ARVs in HIV-1 infected TZM-b1 cells over a concentration range of 0.0002 – 60 nM based on RPV concentration in (F) and CAB concentration in (G). The percentage of infection was normalized to the untreated (no ARV-exposed) cells. A non-linear regression model was used to generate the curve. Error bars represent standard error of the mean (SEM) of 3 replicates.
