
Figure 2.
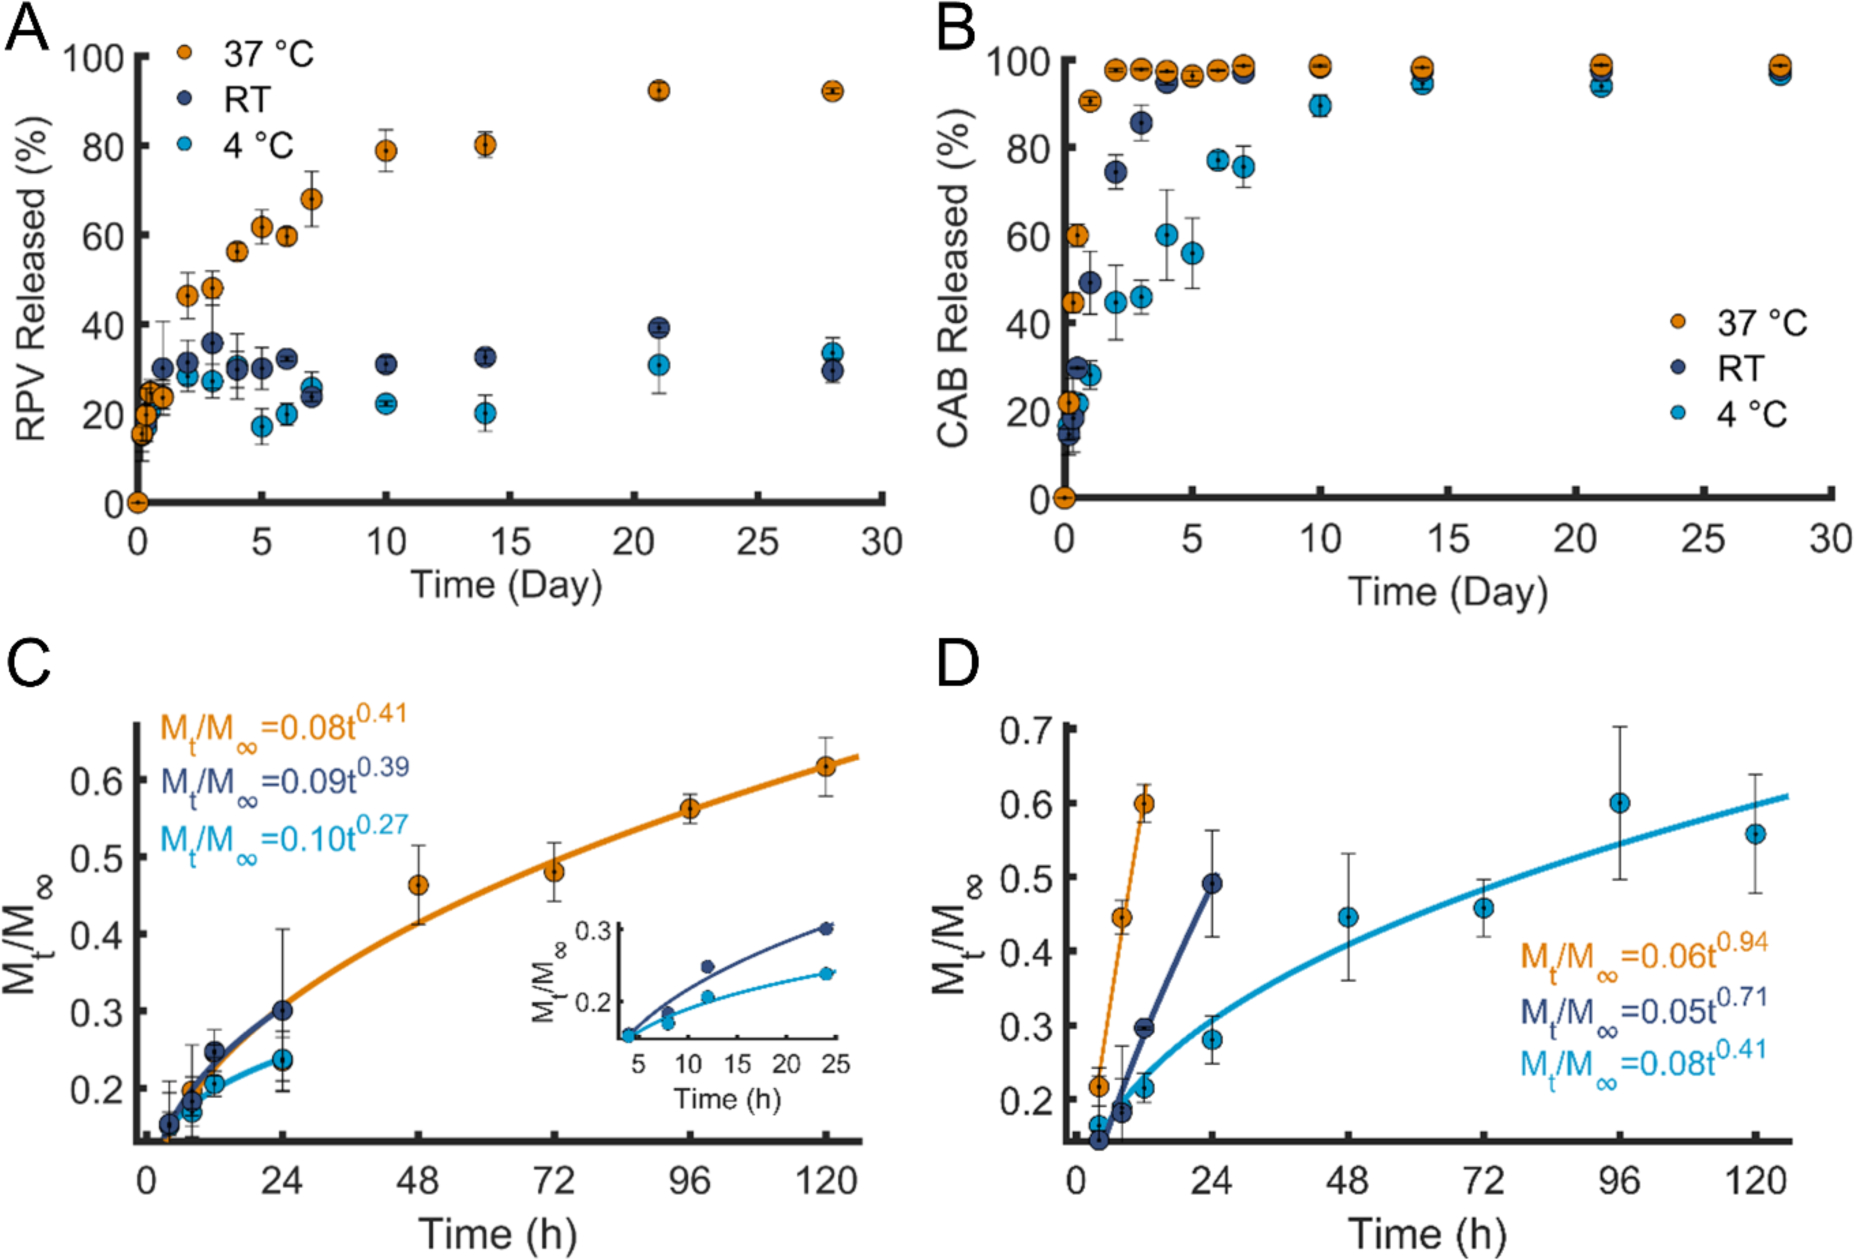
RPV and CAB release kinetics in GM3 PLA NPs. A) Percentage of the RPV released at 4°C, RT, and 37 °C in 1 × PBS over a duration of 28 days. B) Percentage of the CAB released at 4°C, RT, and 37 °C in 1 × PBS over a duration of 28 days. C) The Korsmeyer-Peppas fits and equations of the first 60% of RPV released, the insets shows the zoomed in view of RPV released at 4 °C and RT. The R2 of the corresponding fits are 0.9623 (4 °C), 0.9588 (RT), and 0.9564 (37 °C). D) The Korsmeyer-Peppas fits and equations of the first 60% of CAB released. The R2 of the corresponding fits are 0.9698 (4 °C), 0.9543 (RT), and 0.9926 (37 °C). Same colors in A and B are used in C and D. Error bars represent standard error of the mean (SEM) of 3 replicates.