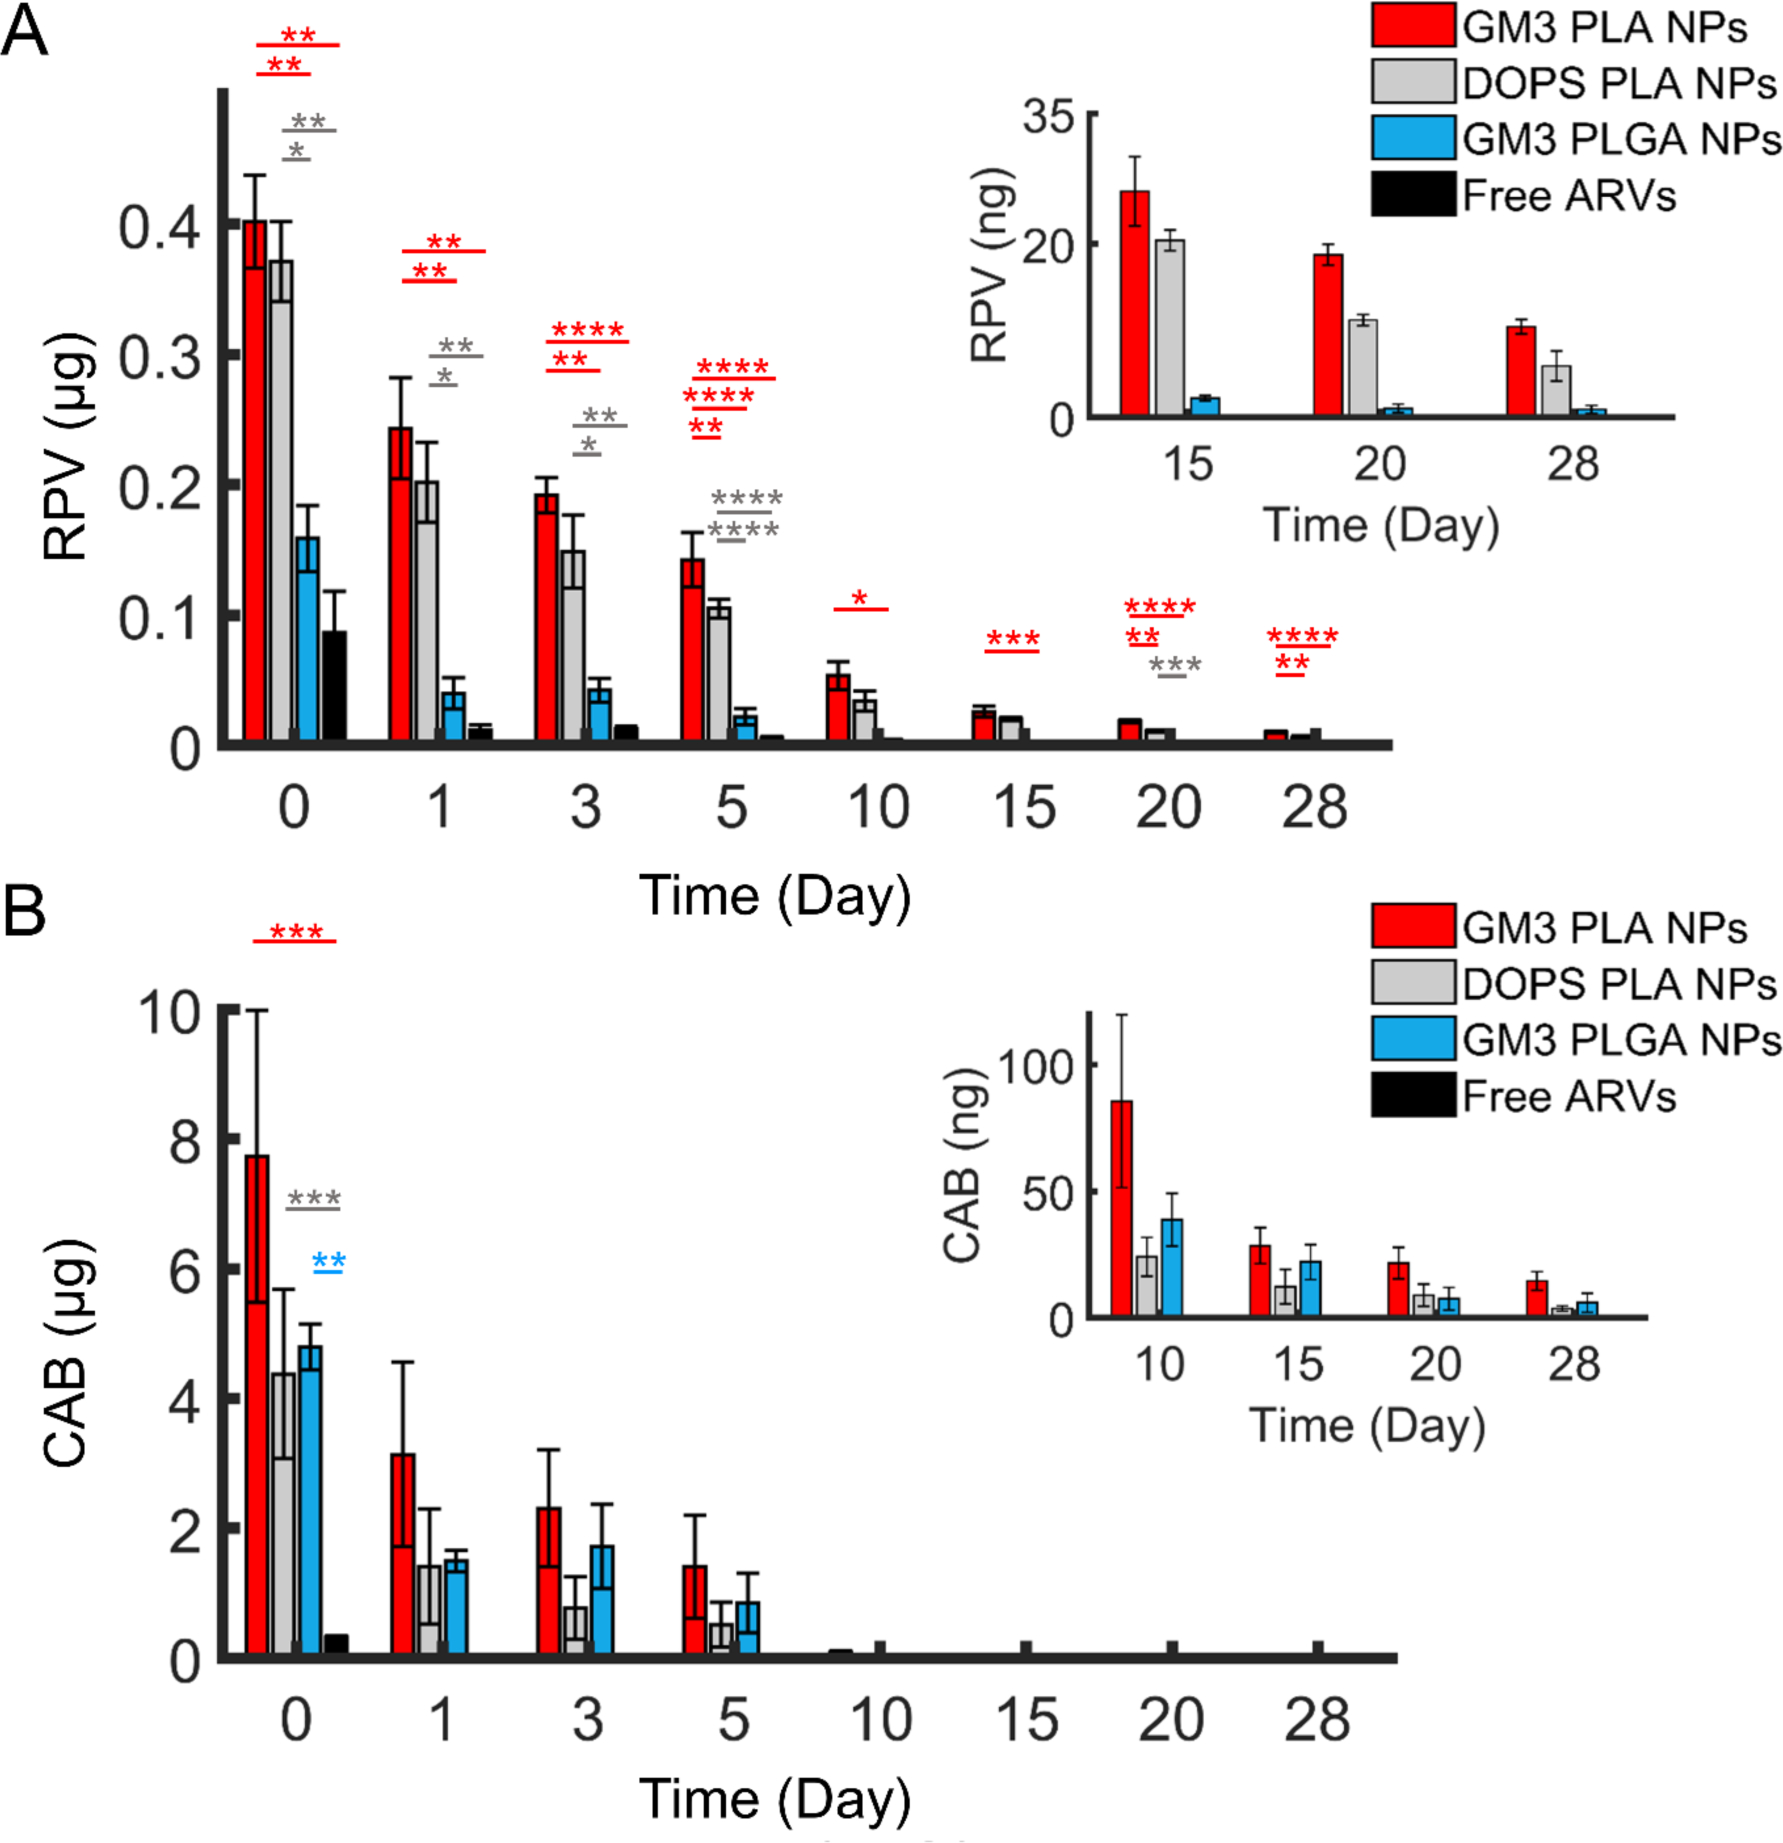
Figure 4.

Quantification of RPV and CAB concentrations in CD169+ MDMs. A) RPV concentration in CD169+ MMDs over 28 days after 3 h incubation with GM3 PLA NPs, DOPS PLA NPs, GM3 PLGA NPs, or free ARVs with a fixed initial RPV concentration of 10 μM per 5 × 10⁵ cells. The inset shows the RPV concentration after day 15. B) CAB concentration in CD169+ MDMs over 28 days in the same cells as in a The initial CAB concentrations were between 45 to 164 μM for different preparations. The inset shows the CAB concentration after day 10. The error bars represents the SEM of 3 different replicates performed with CD169+ MDMs derived from 3 independent donors. Statistical p-values determined using one-way ANOVA followed by a Tukey post-hoc test, *p ≤ 0.05, **p ≤ 0.01, ***p ≤ 0.001, ****p ≤ 0.0001.
