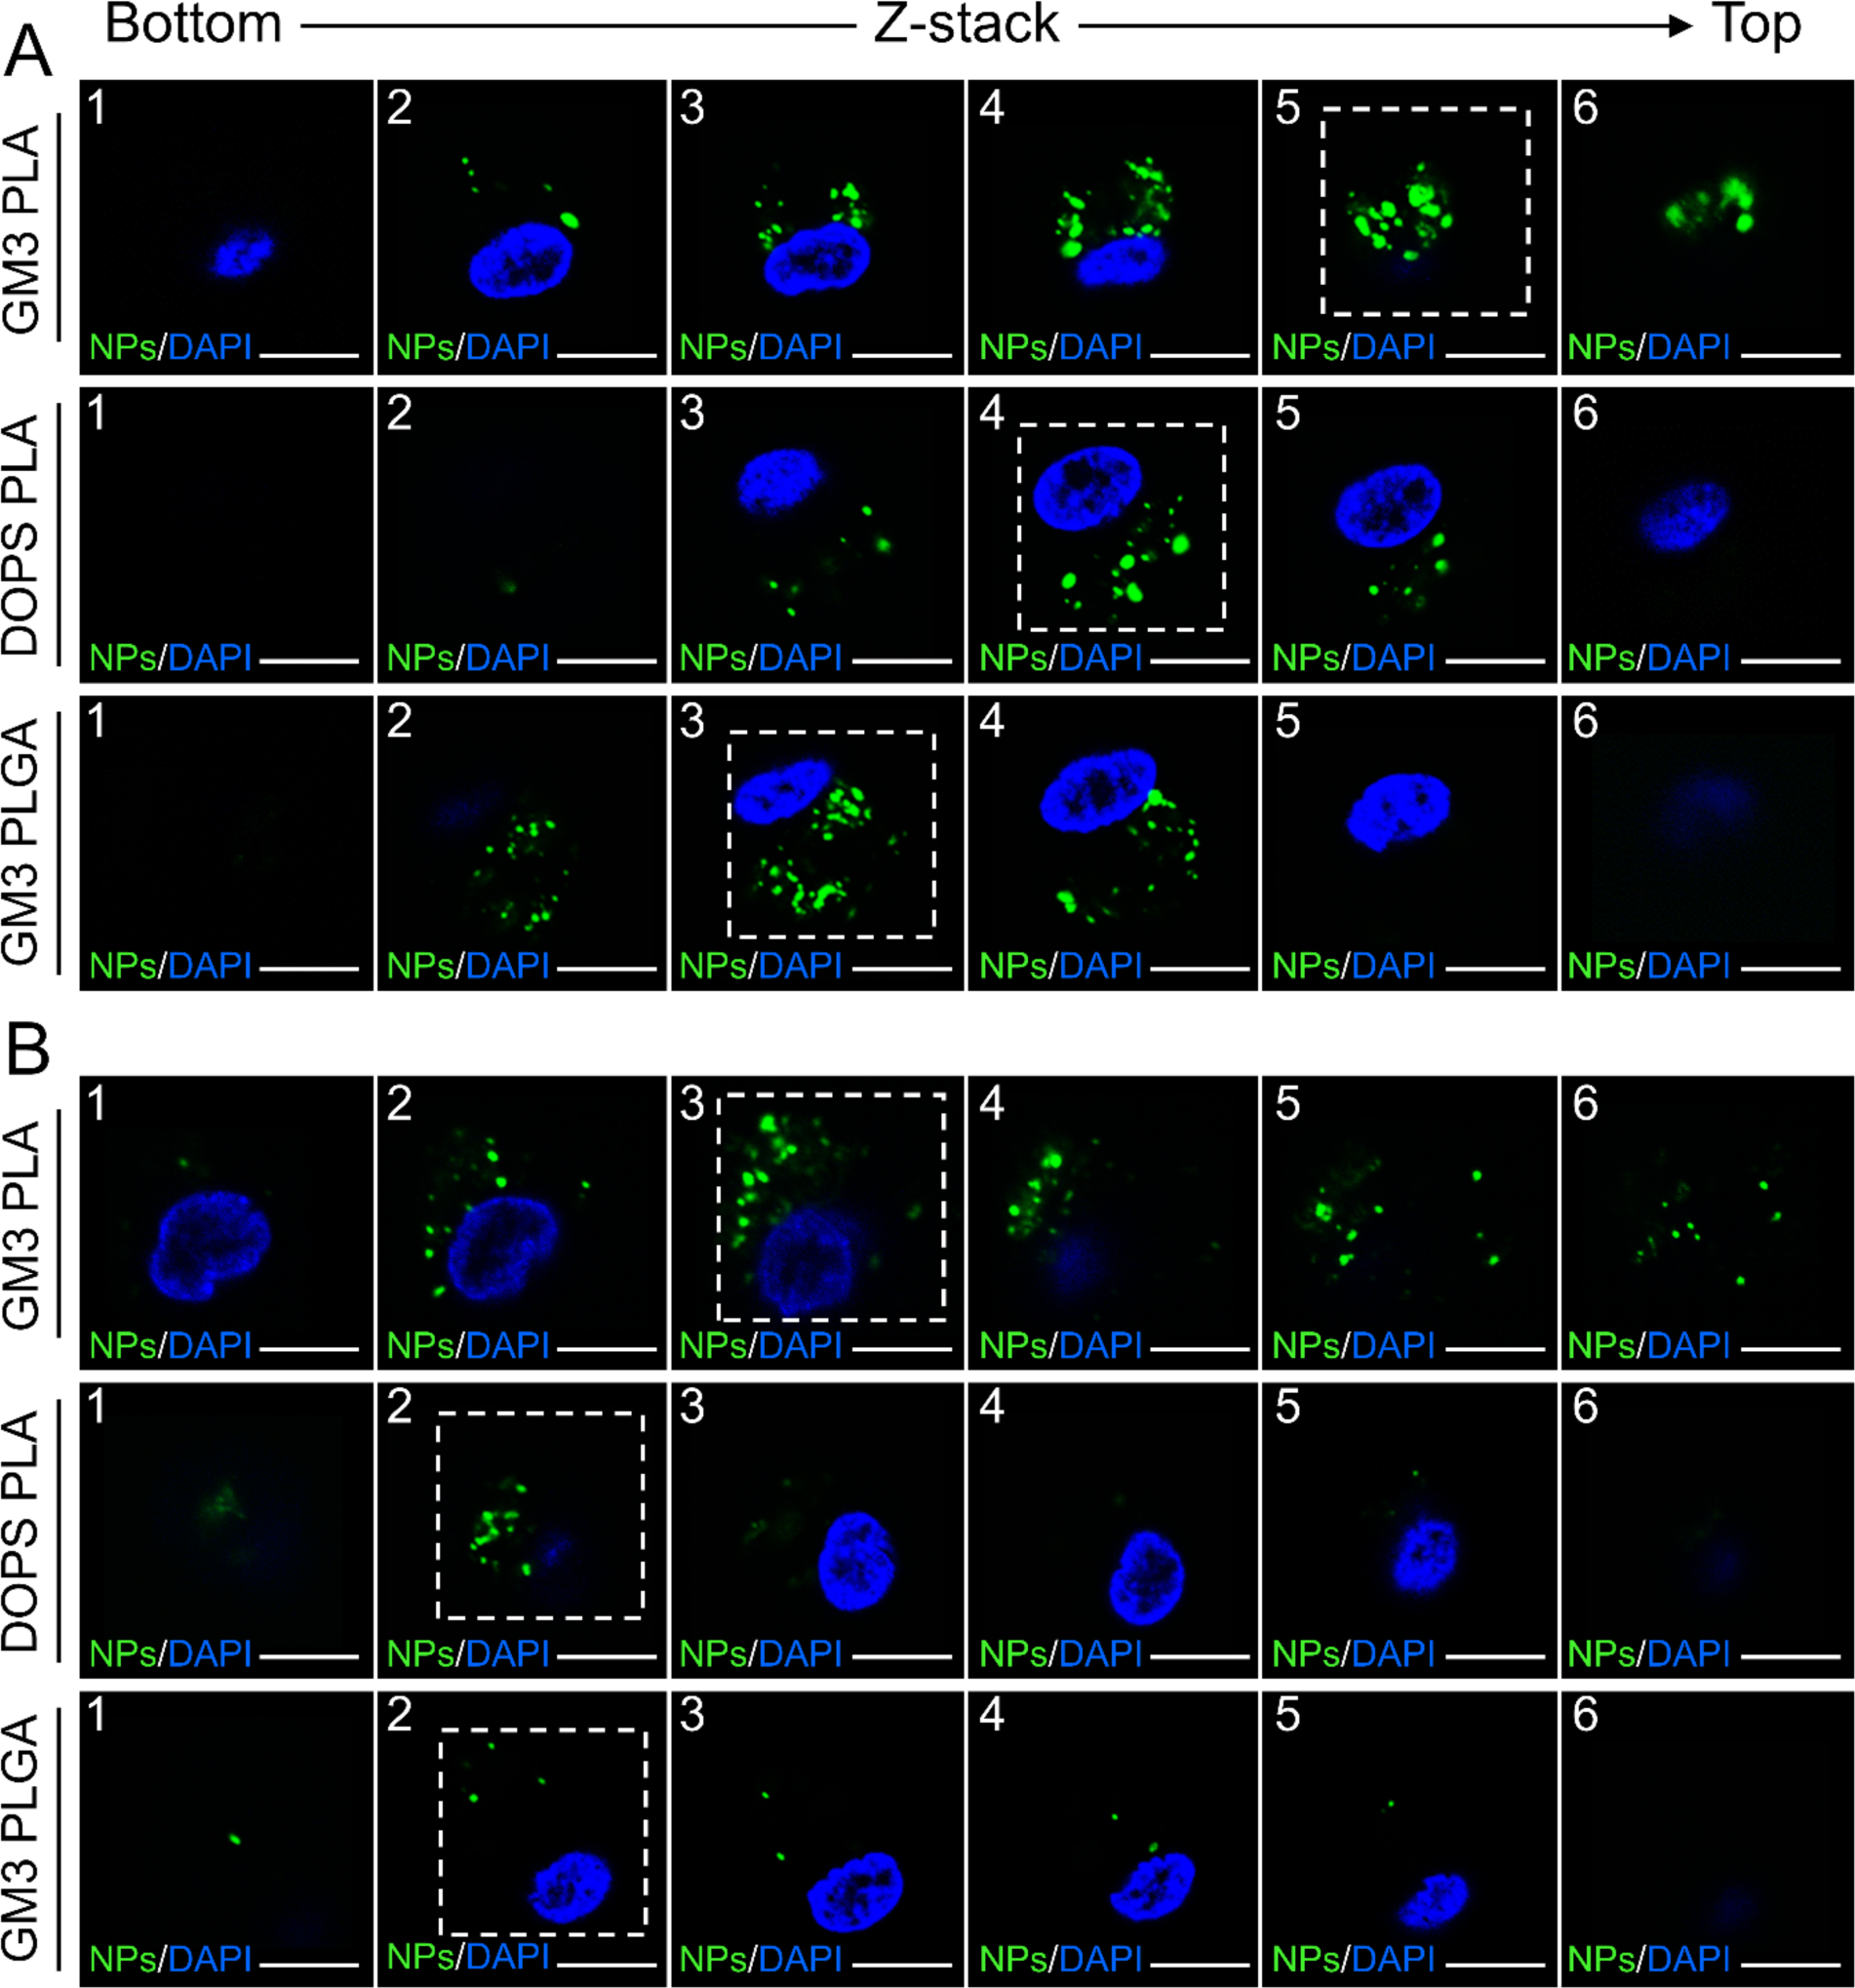
Figure 5.

Localization of GM3 PLA, DOPS PLA, and GM3 PLGA NPs in regard to cell membrane of CD169+ MDMs. A) Confocal z-stack images of CD169+ MDMs 10 days post NP treatment. B) Confocal z-stack images of CD169+ MDMs 25 days post NP treatment. The dashed square is used to demonstrate the section with the highest NP-contained area. Z-stack images were collected at 3 μm steps. Scale bar = 10 μm.
