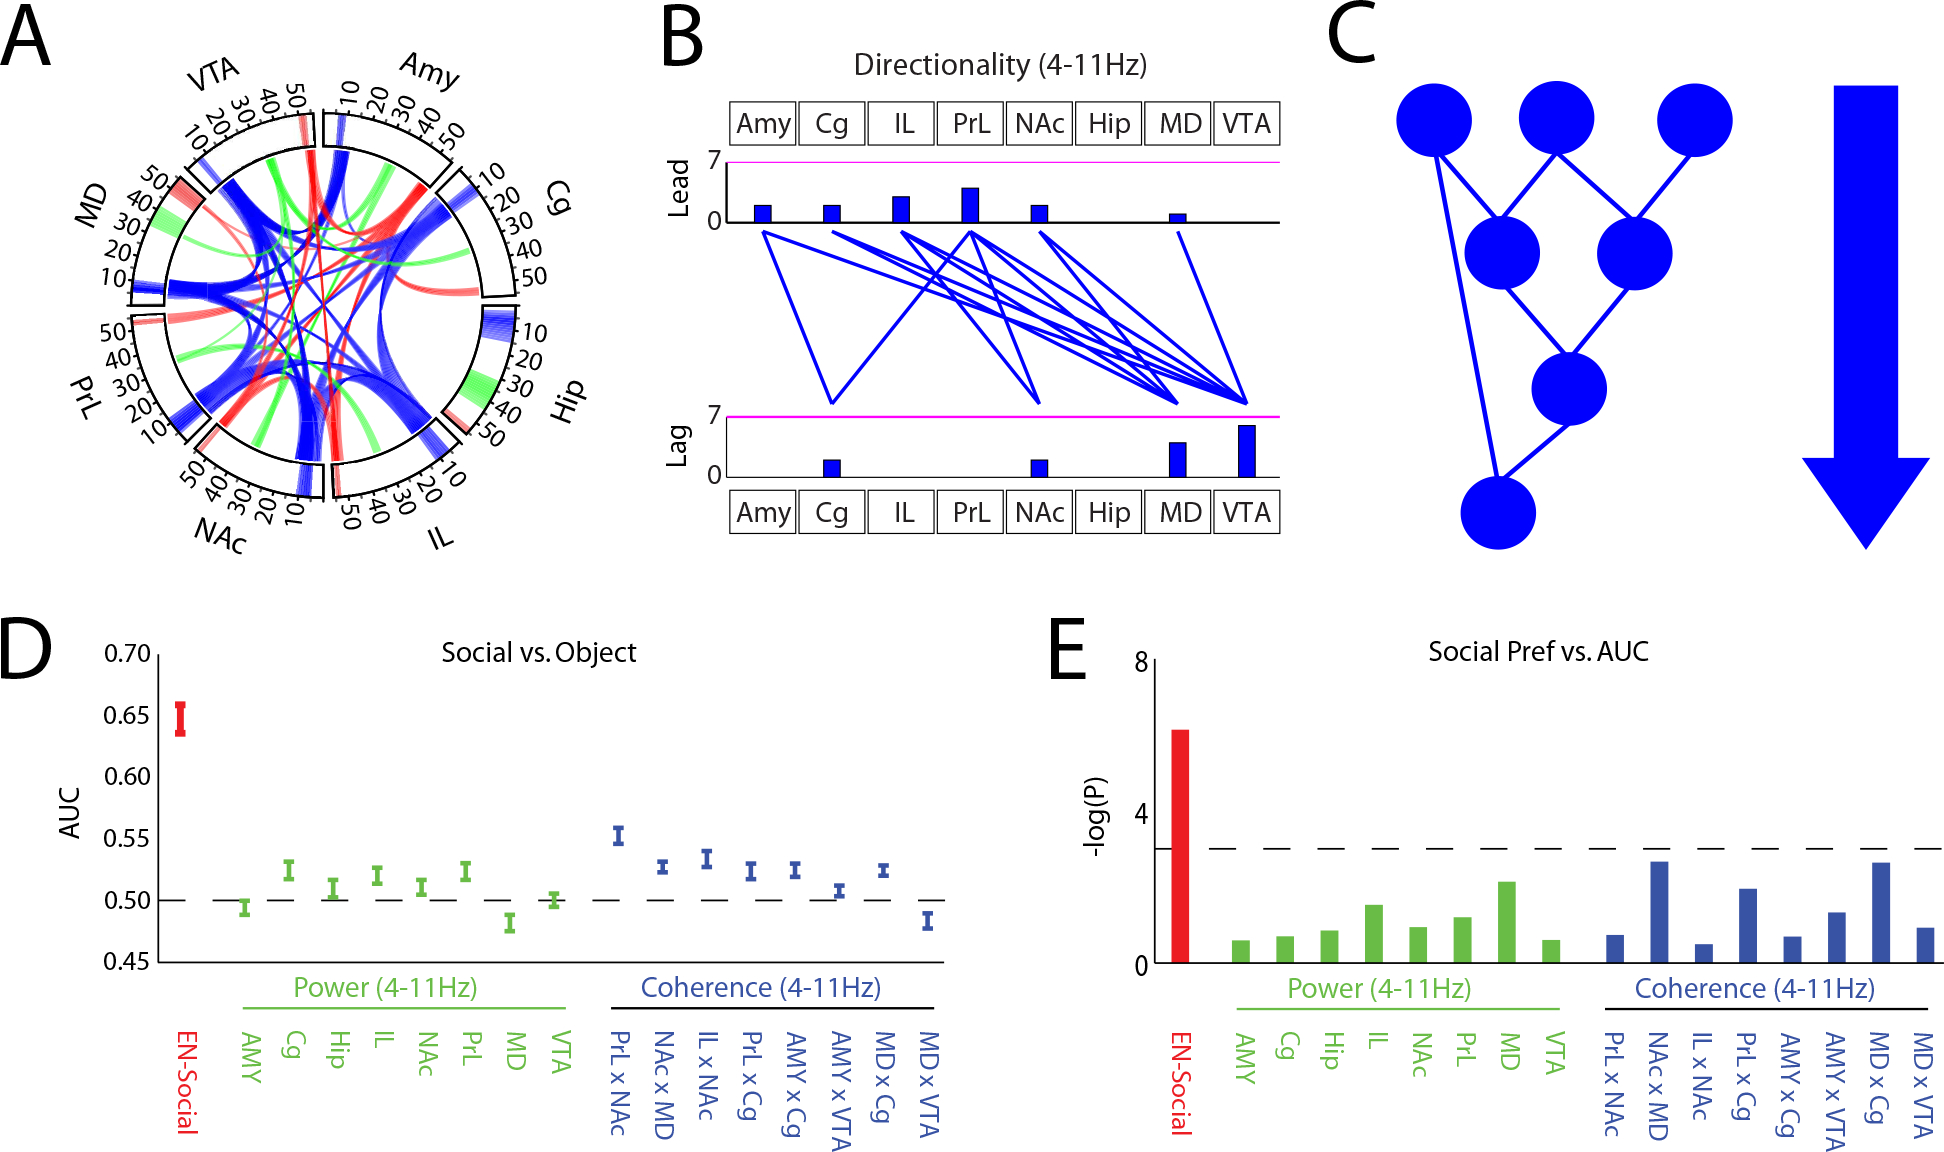
Figure 4: Circuit elements within EN-Social fail to encode individual behavior.

A) Power and synchrony measures that compose EN-Social. Brain areas and oscillatory frequency bands ranging from 1 to 56Hz are shown around the rim of the circle plot. Spectral power measures that contribute to the electome are depicted by the highlights around the rim, and cross spectral (i.e., synchrony) measures are depicted by the lines connecting the brain regions through the center of the circle (electome activity is shown at a relative spectral density threshold of 0.33, signifying the 85th percentile of retained features). B) Granger offset measures were used to quantify directionality within the electome network. Prominent directionality was observed across the theta (4–11Hz) frequency band (shown at a spectral density threshold of 0.33). Histograms quantify the number of lead and lagging circuit interactions for each brain region. C) Schematic of signal directionality within EN-Social. D) Decoding accuracy of EN-Social circuit elements for social vs. object interactions. E) Decoding accuracy of EN-Social circuit element activity within animal vs. social preference using spearman correlation. Threshold corresponds with P<0.05.
