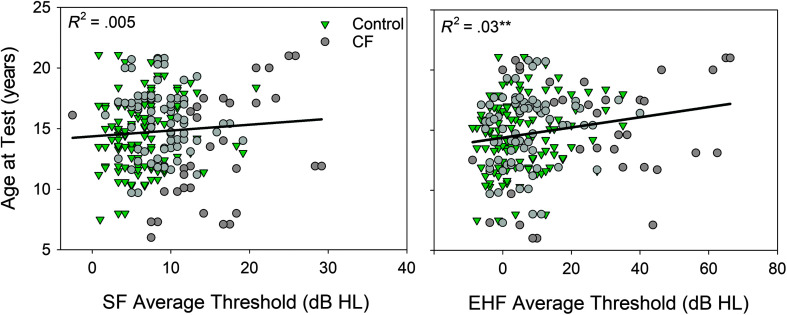
Figure 2.
Participant age at test plotted as a function of average hearing thresholds for the control and cystic fibrosis (CF) groups. Standard frequency average thresholds (SF; 0.25–8 kHz) are displayed on the left, and extended high-frequency average thresholds (EHF; 10–16 kHz) are displayed on the right. Regression lines and the coefficient of determination are displayed in each figure. *p < .05, **p < .01, ***p < .001.

