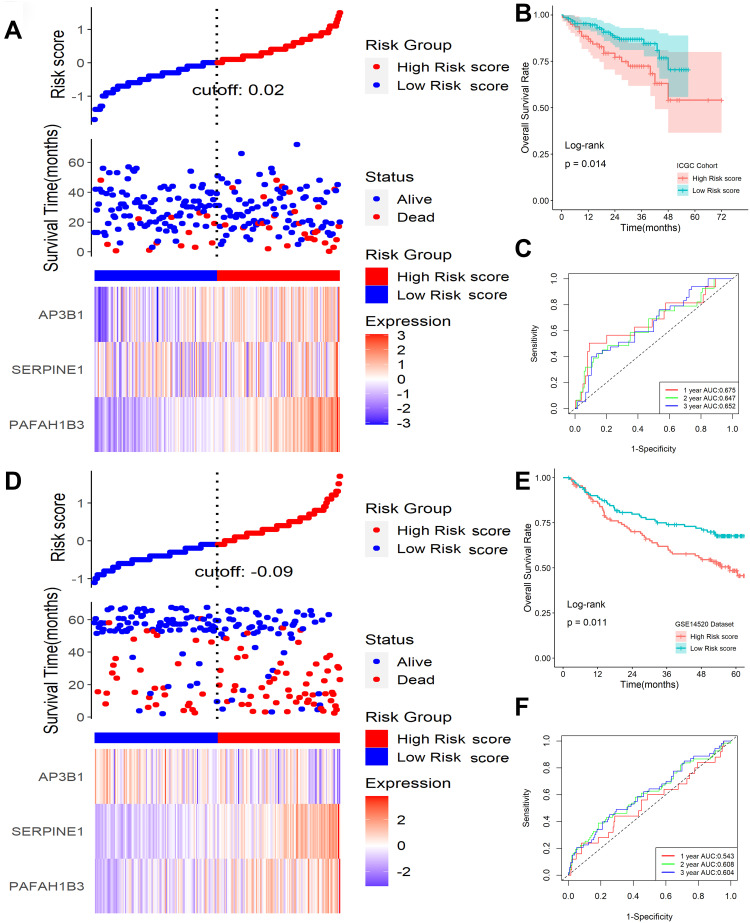
Figure 5.
Validation of this classifier in ICGC and GSE14520 cohorts. (A) Distribution of risk scores, OS status, and gene expression profiles in ICGC cohort. (B) Kaplan-Meier survival plot in ICGC cohort. (C) Characteristics of predicted 1-, 2-, and 3-year OS rates in ROC analysis in ICGC cohort. (D) Distribution of risk scores, OS status, and gene expression profiles in the GSE14520 cohort. (E) Kaplan-Meier survival plot in GSE14520 cohort. (F) Characteristics of predicted 1-, 2-, and 3-year OS rates in ROC analysis in GSE14520 cohort.

