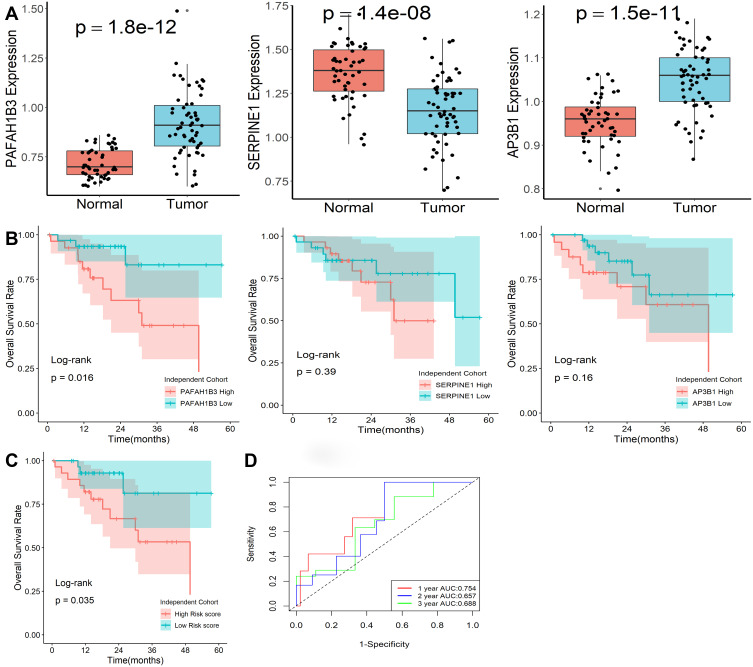
Figure 7.
Expression levels of genes in this classifier detected by qRT-PCR. (A) Expression levels of the three mRNA molecules were explored in 50 normal and 59 HCC tissues. (B) Kaplan-Meier survival plot of the three genes in 59 HCC tissues. (C) Kaplan-Meier survival plot of risk score. (D) Characteristics of predicted 1-, 2-, and 3-year OS rates in ROC analysis.

