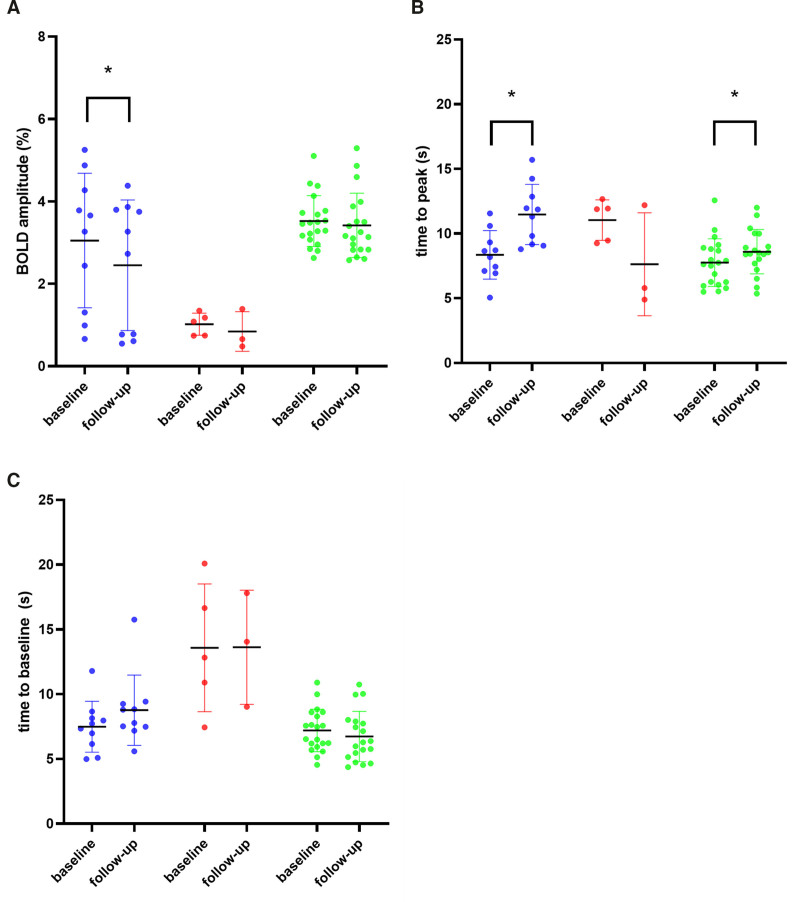
Figure 2.
Shows the individual data points for vasomotor reactivity parameters at baseline and follow-up. Blood-oxygen-level-dependent (BOLD) amplitude (A), time to peak (B) and time to baseline (C) are shown. Presymptomatic Dutch-type hereditary cerebral amyloid angiopathy (D-CAA) mutation carriers are represented in blue, symptomatic mutation carriers in red, and controls in green. Significant longitudinal differences are shown with an asterisk.

