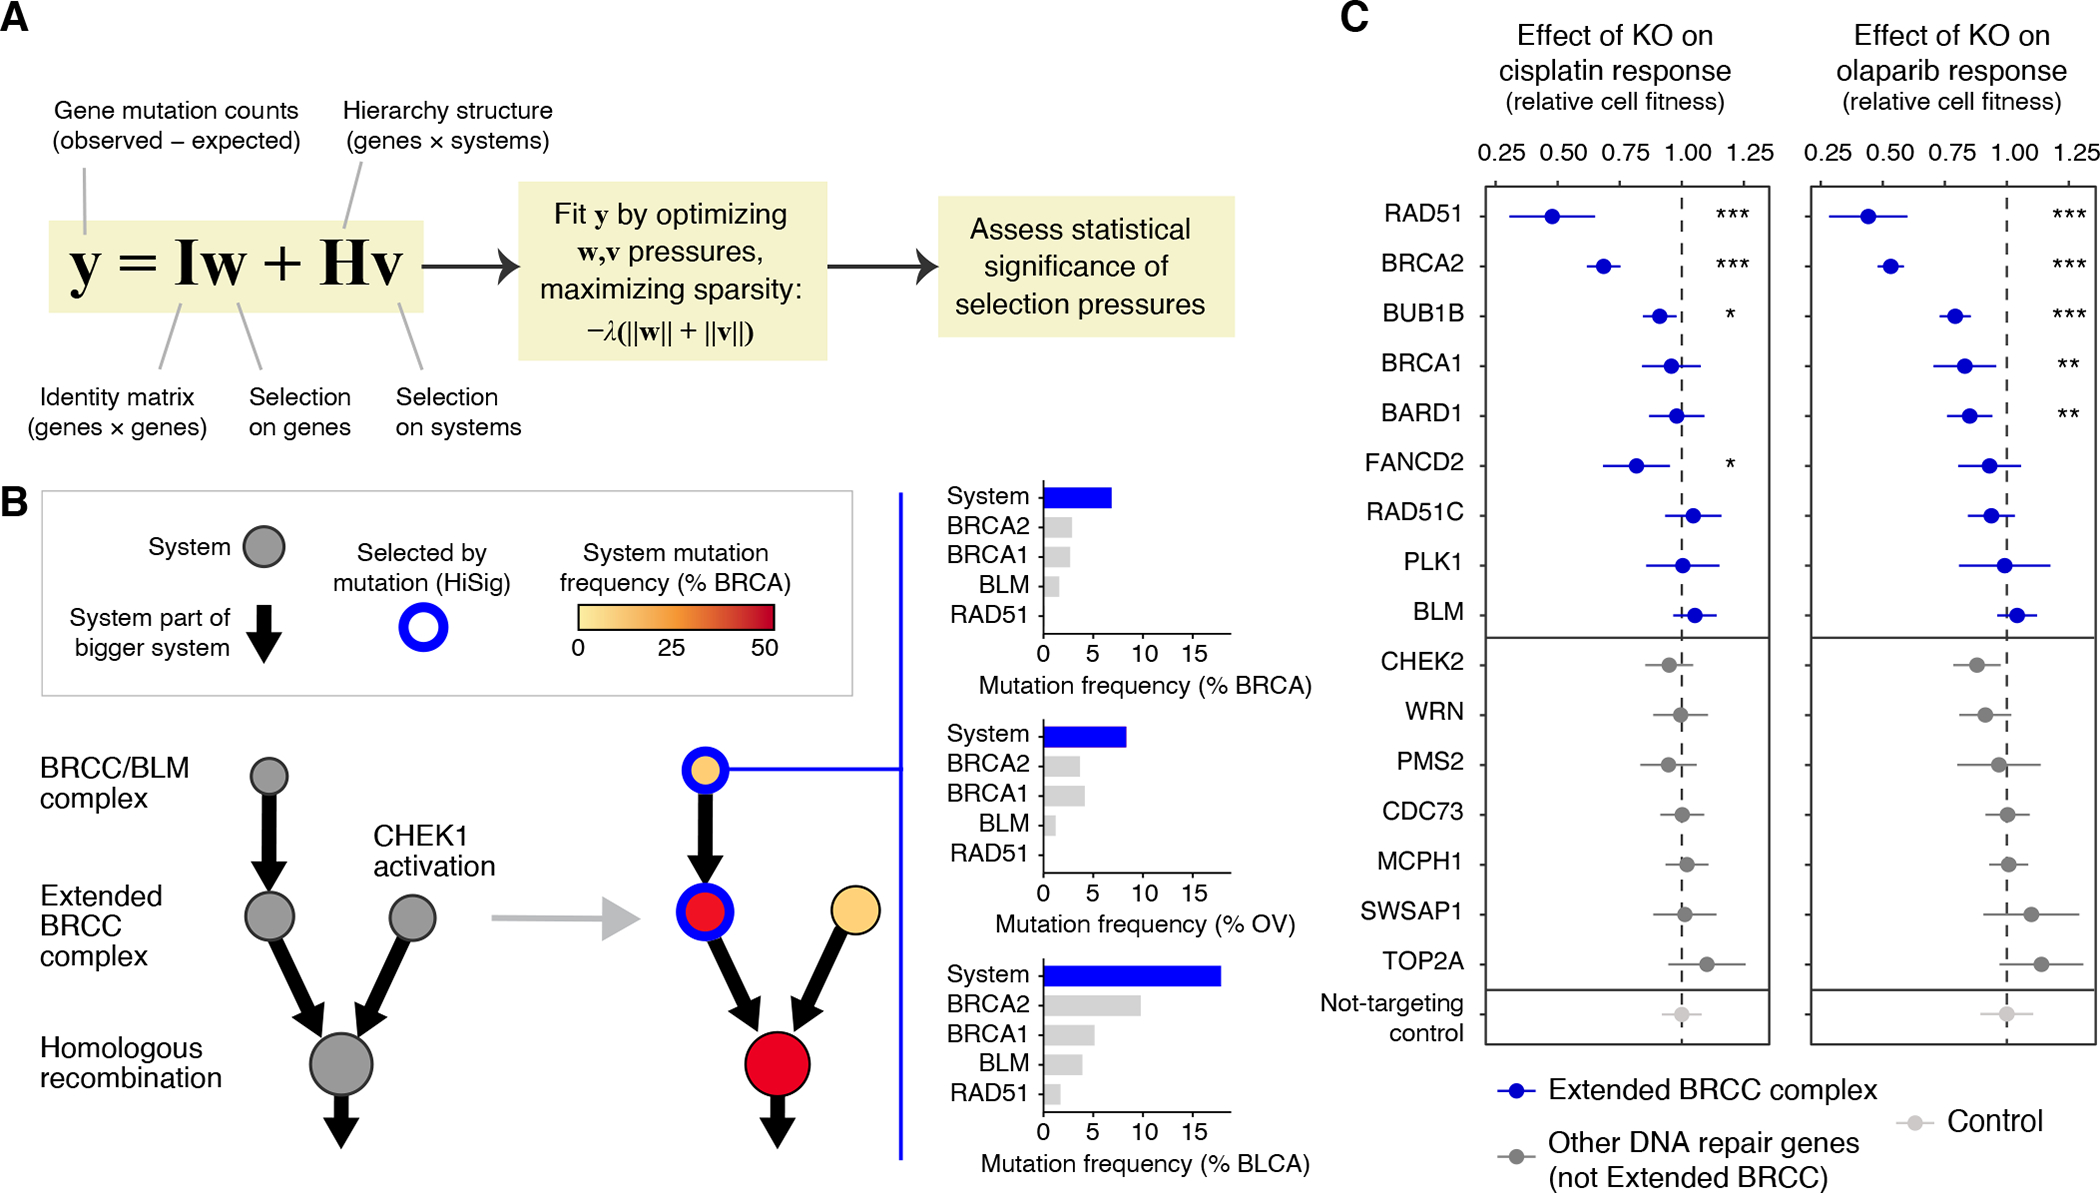
Fig. 3. Convergence of mutations within protein systems.

(A) HiSig model for identification of significantly mutated systems. A regularized lasso regression model is fit to the observed mutation counts (y) of genes in a cohort, by adjusting mutation pressures (w, v) on genes and systems, respectively. The λ term penalizes models that lack sparsity, i.e., placing pressures on many genes or systems. Systems harboring frequent mutations that are not well-explained by pressures on any single gene will have positive pressures v after solving the penalized regression. (B) Hierarchy of systems related to homologous recombination, extracted from the IAS network and analyzed for mutation frequency in breast cancer (BRCA, red color gradient on nodes). Blue node borders indicate significantly mutated systems selected by HiSig. Bar charts at right show system- and gene-level mutation frequencies for the “BRCC/BLM complex” in breast, ovarian and bladder cancers (BRCA, OV, BLCA). (C) Effects of CRISPR-Cas9 gene knockouts (rows) on the response to cisplatin (left) or olaparib (right) in the SW1710 bladder cancer cell line. Error bars: mean ± 95% CI. The cell fitness resulting from each knockout is compared to that of non-targeting controls via t-test with Benjamini-Hochberg multiple-testing correction, with significant differences indicated: *: P < 0.05; **: P < 0.01; ***: P < 0.001.
