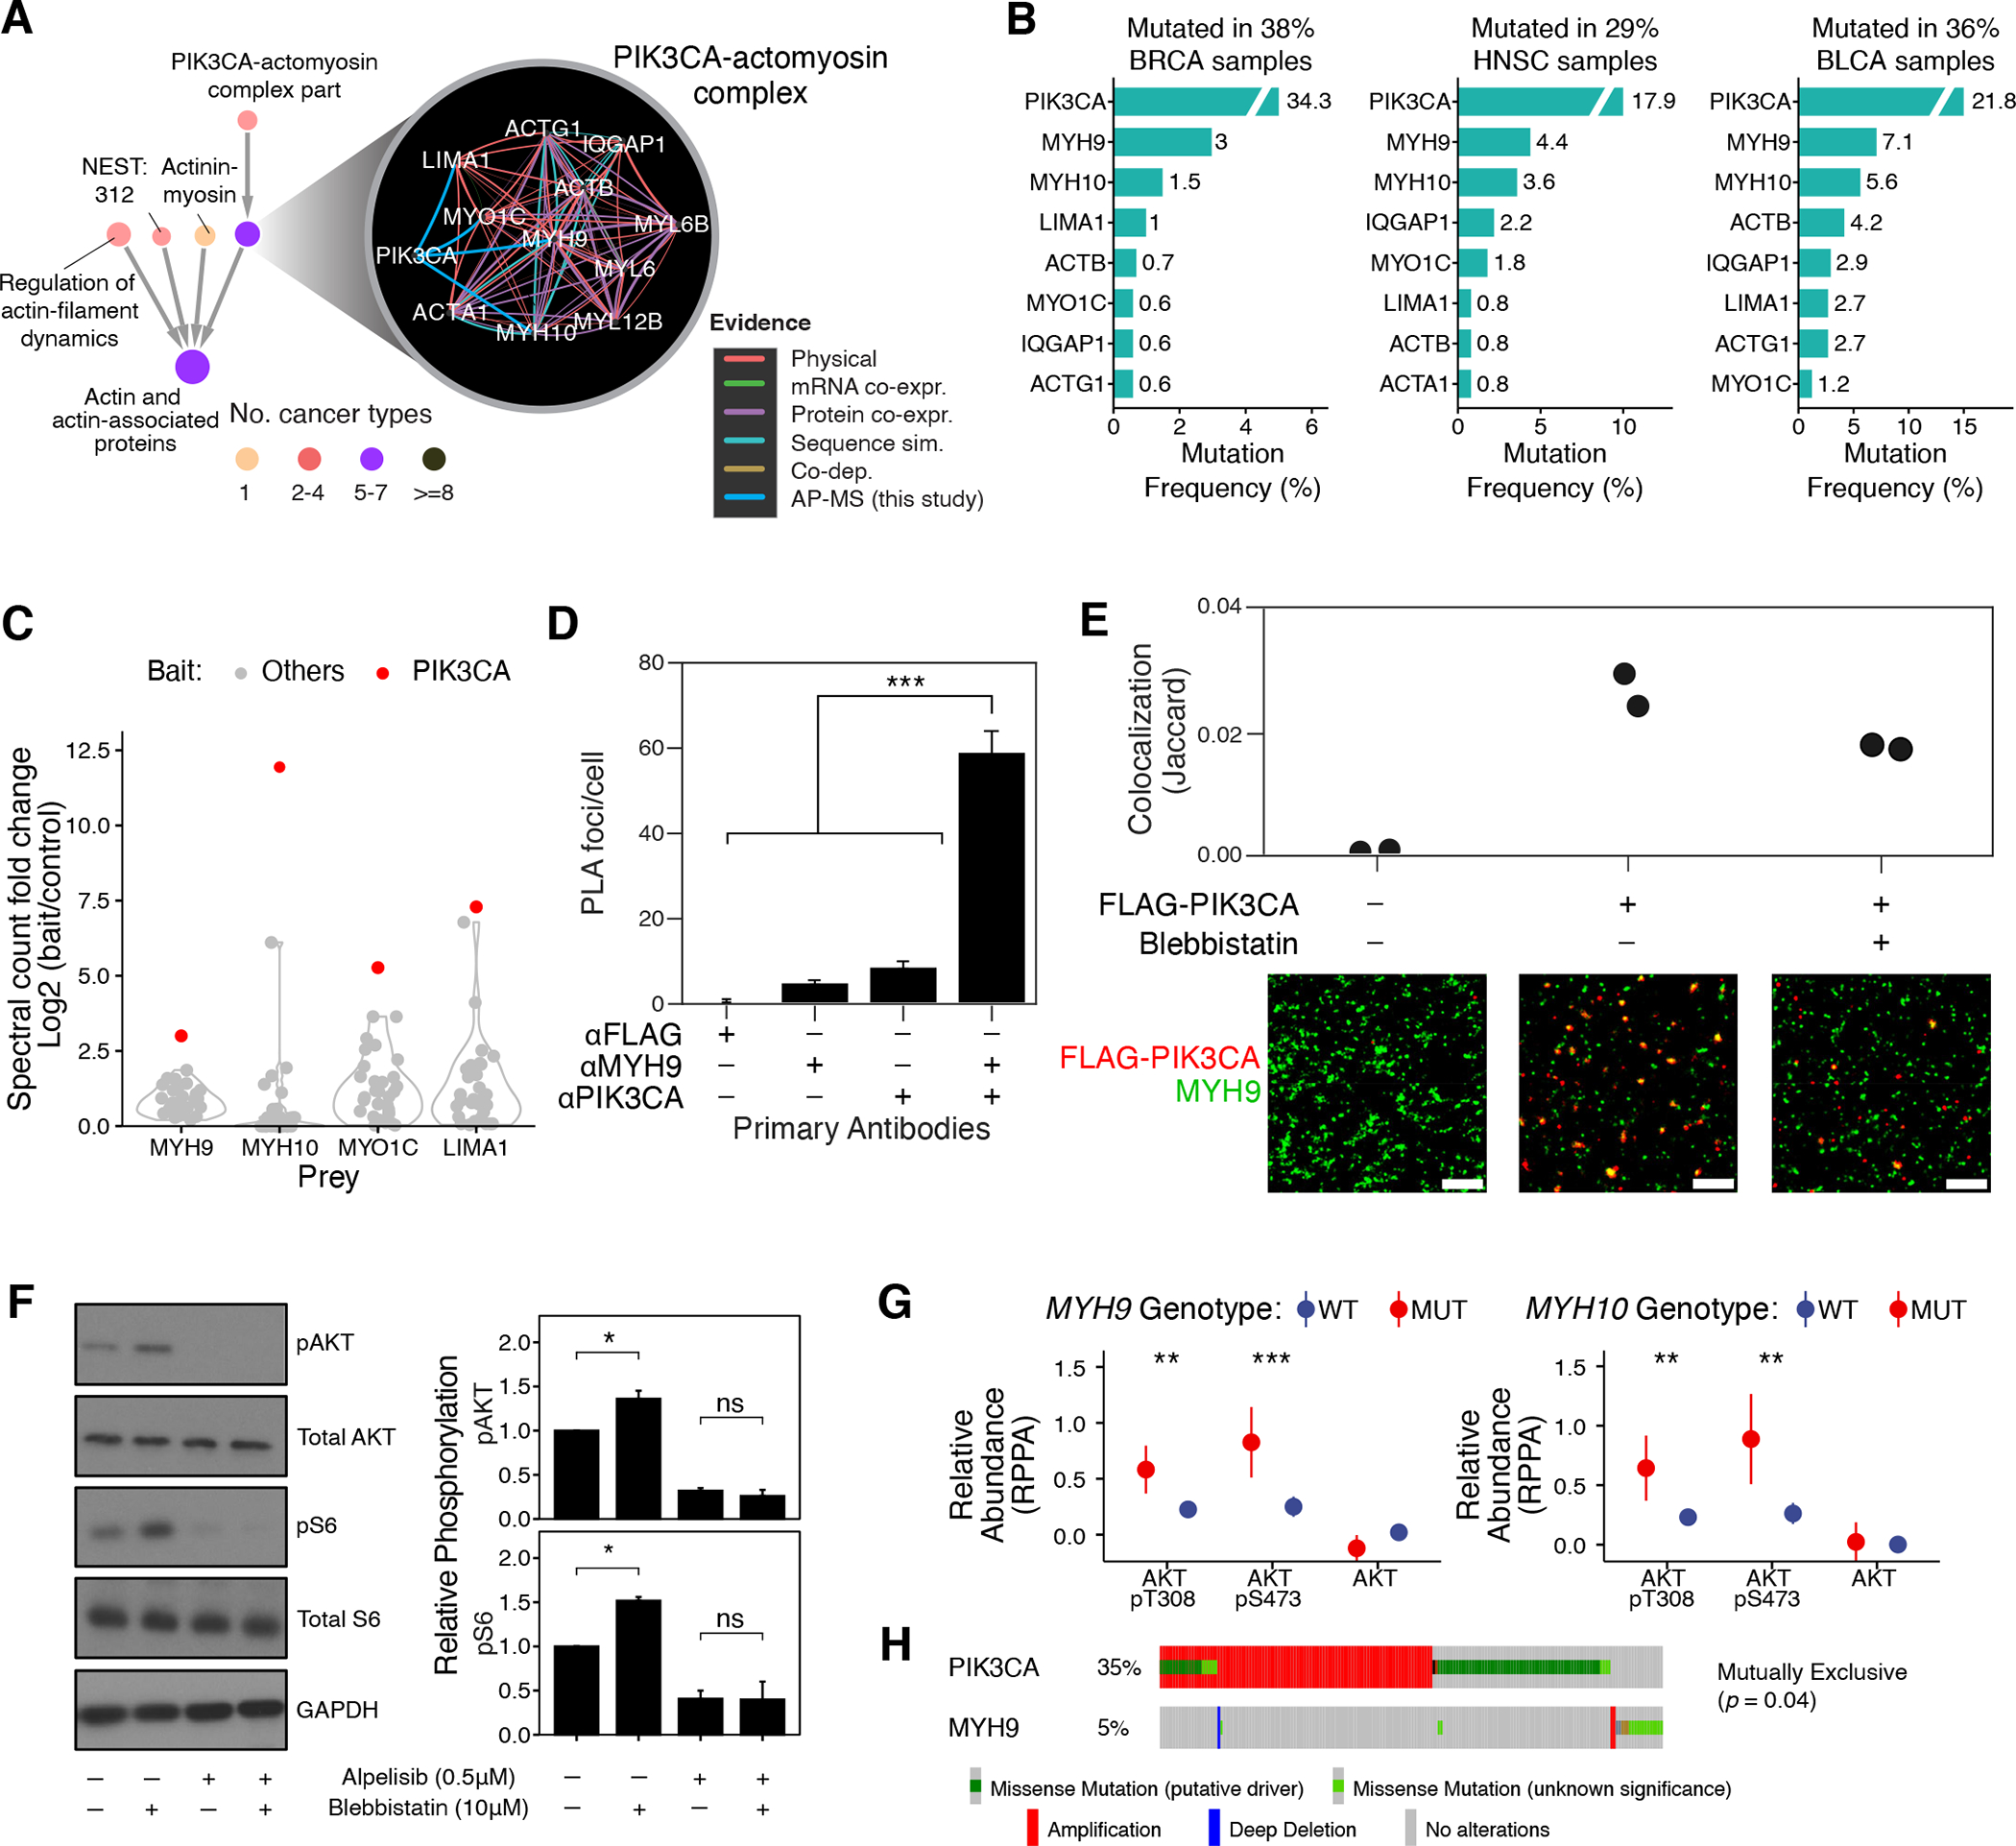
Fig. 5. A PIK3CA-actomyosin assembly regulating the PI3K/AKT pathway.

(A) Interactions defining the PIK3CA-actomyosin complex and the context of this system in the NeST hierarchy. (B) Mutation frequencies of genes in this system (shown top seven frequently mutated genes in each cohort). (C) Signal (spectral count fold change versus control) of actomyosin proteins (MYH9, MYH10, MYO1C, LIMA1) in AP-MS experiments with cancer protein baits. Red dots represent signal as interactors of PIK3CA in the CAL-33 cell line; gray dots show corresponding data for other cancer proteins. (D) Per-cell counts of proximity ligation foci when probing for PIK3CA and MYH9 in CAL-33 cells; significantly more foci are observed when probing for both proteins. ***: P <0.001 by one-tailed Student’s T test. (E) CAL-33 cell lines expressing FLAG-PIK3CA (as used in AP/MS experiments) were probed with anti-FLAG and anti-MYH9 antibodies and imaged by DNA-PAINT. Substantial colocalization is observed in small, membrane-proximal puncta. Representative subfields are shown below; scale bar is 500nm. (F) CAL-33 cells were treated with DMSO, blebbistatin (10 μM) and/or alpelisib (0.5 μM) and harvested with indicated antibodies for immunoblotting (N = 3; a representative image is displayed). Signals were normalized relative to total protein and loading control. Error bars indicate mean ± standard error; *: P < 0.05 by one-way ANOVA; images are representative of 3 independent experiments; N = 6 for all measurements. (G) Comparison of the RPPA-measured abundance of indicated phosphorylated/total proteins between cancer cell lines (78) (N = 899) with MYH9 (N = 108) or MYH10 (N = 82) mutations and the wild-type lines. (H) Genomic alterations of PIK3CA and MYH9 in the TCGA-HNSC cohort show a pattern of mutual exclusivity. Wilcoxon rank sum test was used for G and H. *: P < 0.05; **: P < 0.01; ***: P < 0.001; ****: P < 0.0001.
