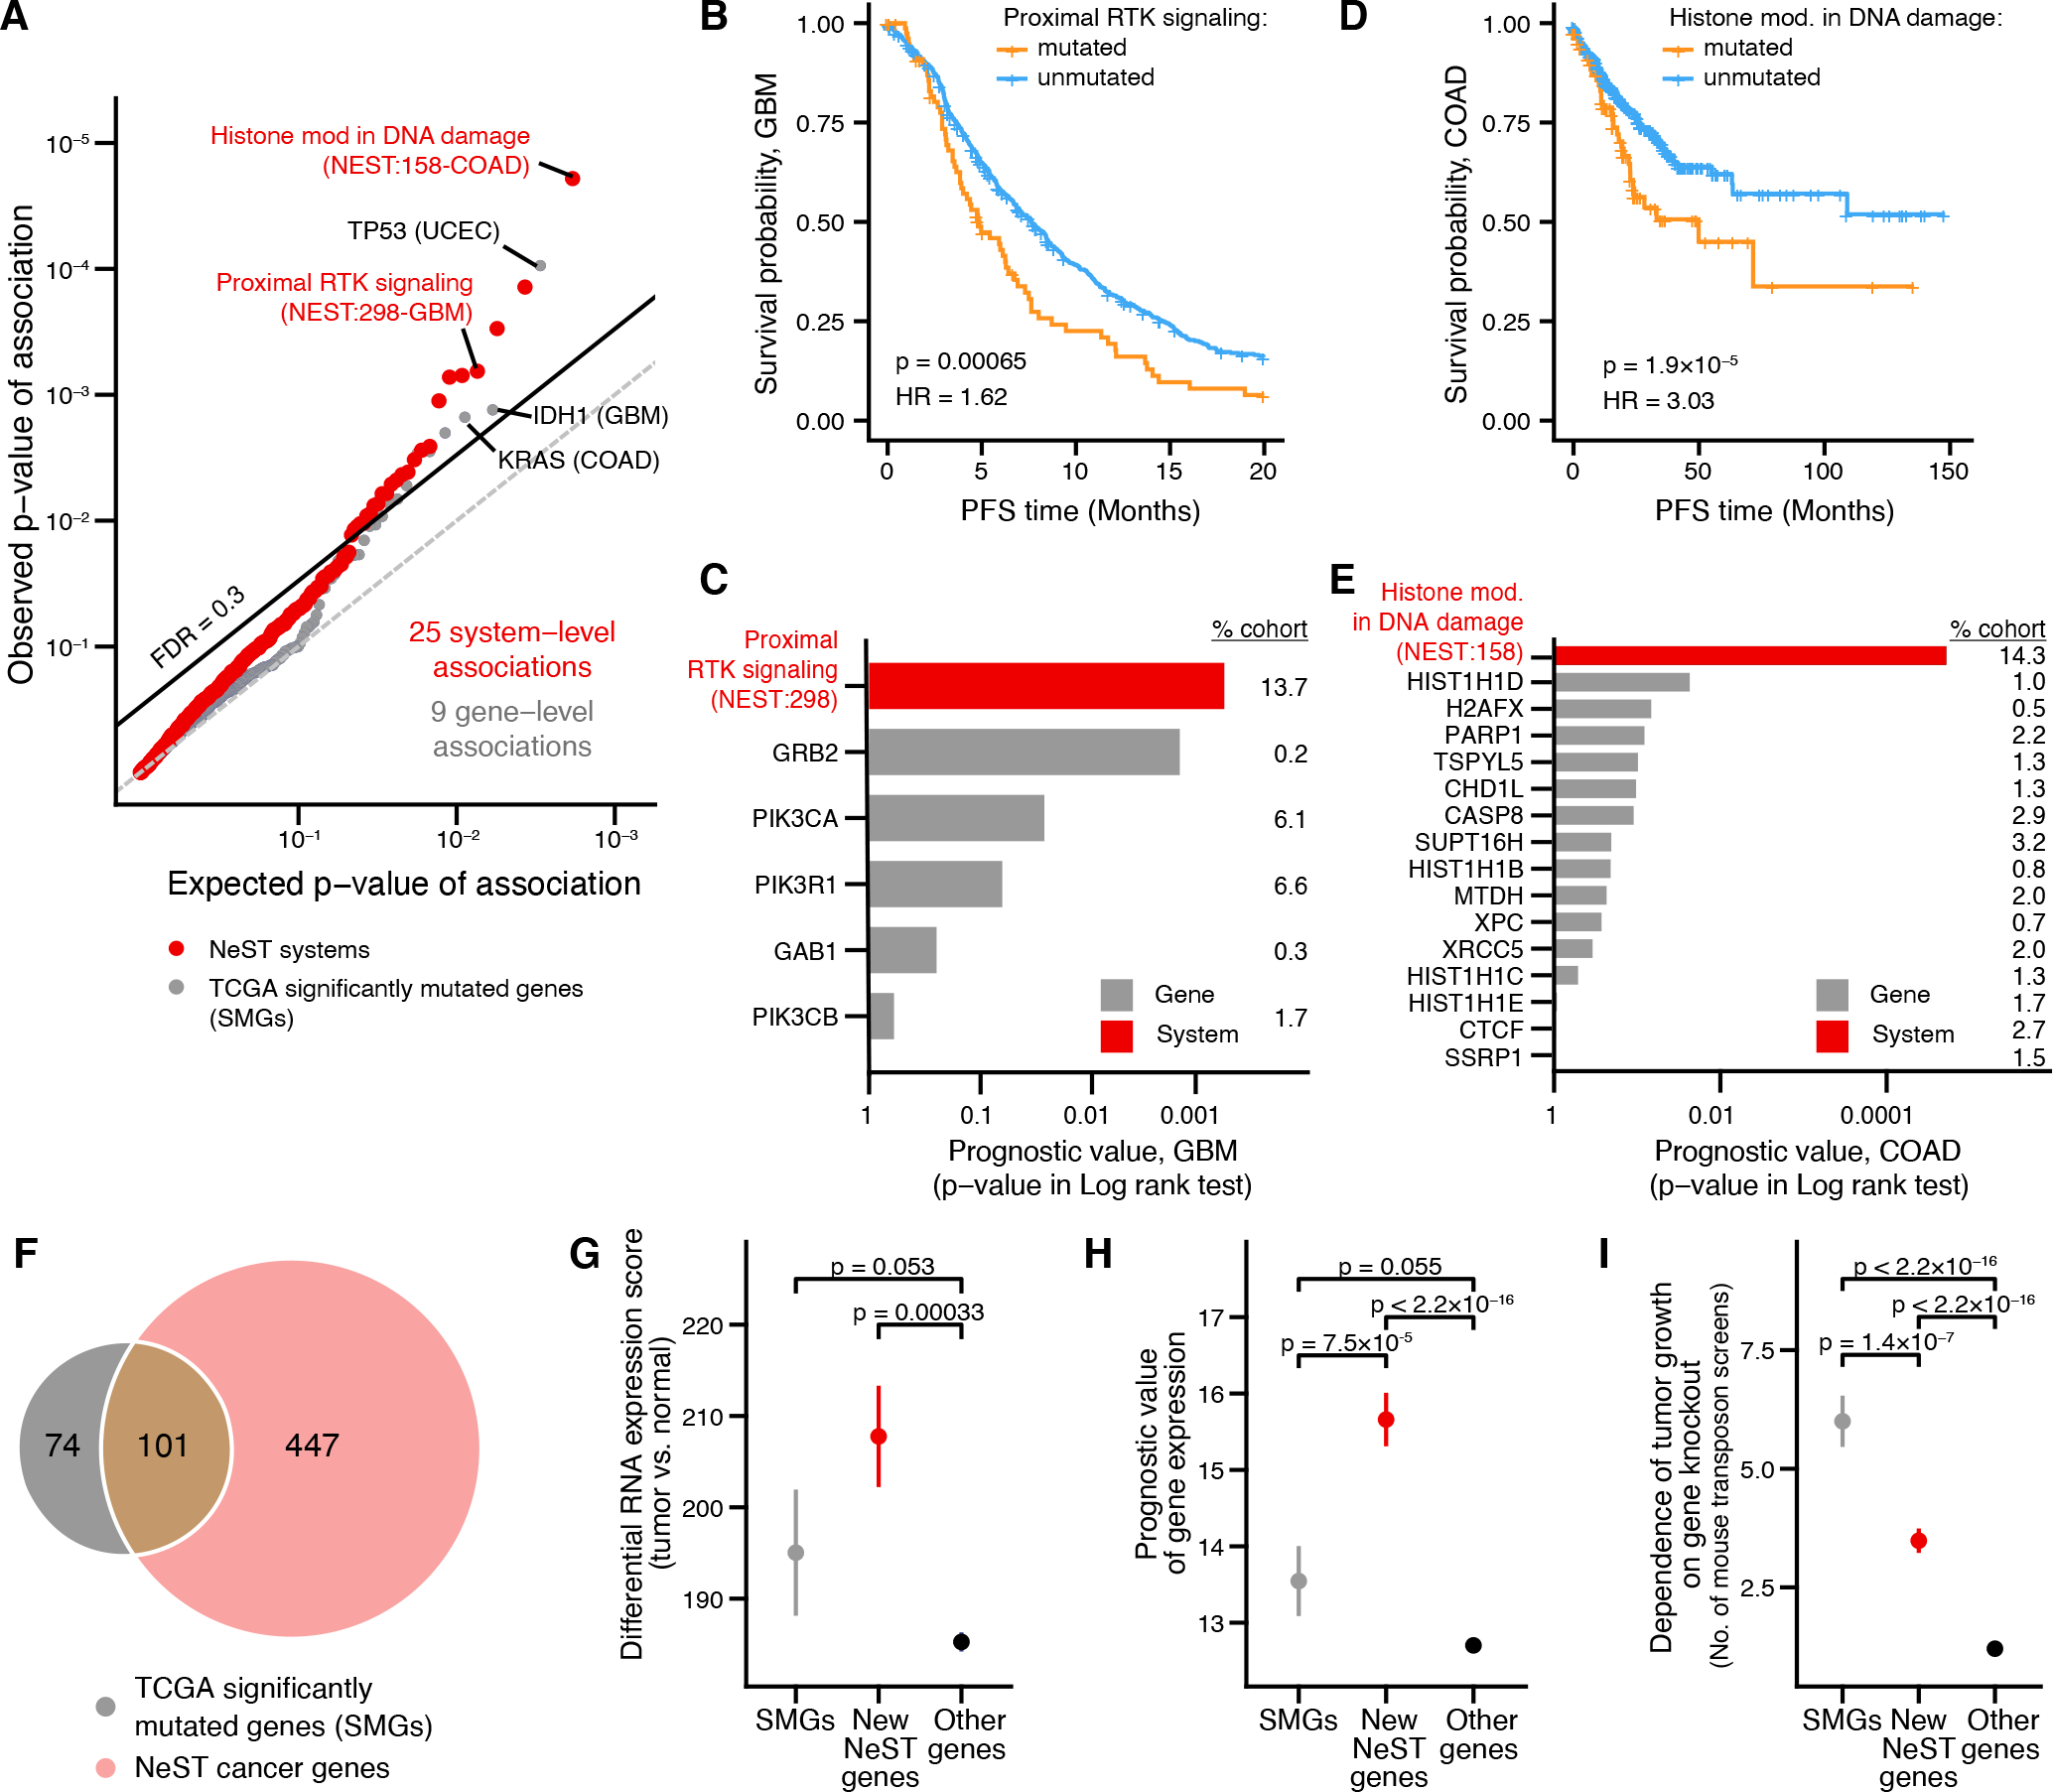
Fig. 7. Protein systems inform clinical markers and lists of cancer genes.

(A) Significance of prognostic association between biomarker status (mutated/unmutated) and progression free survival (PFS). Red points represent systems; gray points represent genes. Observed P-values are plotted versus those expected when performing the same number of tests at random. The dashed line indicates a cutoff of FDR = 0.3. Relevant tissue type for each association shown in parentheses. (B-E) Selected NeST systems associated with prognosis: (B, C) NeST:298, “Proximal RTK signaling.” (D, E) NeST:158, “Histone modification in DNA damage response.” Kaplan-Meier curves (B, D) stratify tumors based on mutation status of each system. Lower bar charts (C, E) indicate significance of association (log-rank test) between mutation status and PFS for systems (black bars) versus individual genes in those systems (gray bars) Numbers on the right indicate the percentage of patients in that cohort with mutations in the indicated gene. (F) Venn diagram showing the common and distinct genes identified by significantly mutated systems in NeST (pink) versus TCGA PanCancer analysis (gray) (37). (G-I) Functional support for NeST cancer genes: (G) RNAseq tumor-normal differential expression in TCGA (126). (H) Prognostic value of mRNA expression in TCGA (127). (I) Number of times a gene has been identified in independent cancer genetic screens in mice (128). Whisker plots show mean ± stderr. Asterisk (*) indicates significant difference by one-sided Wilcoxon rank sum test, P < 0.05.
