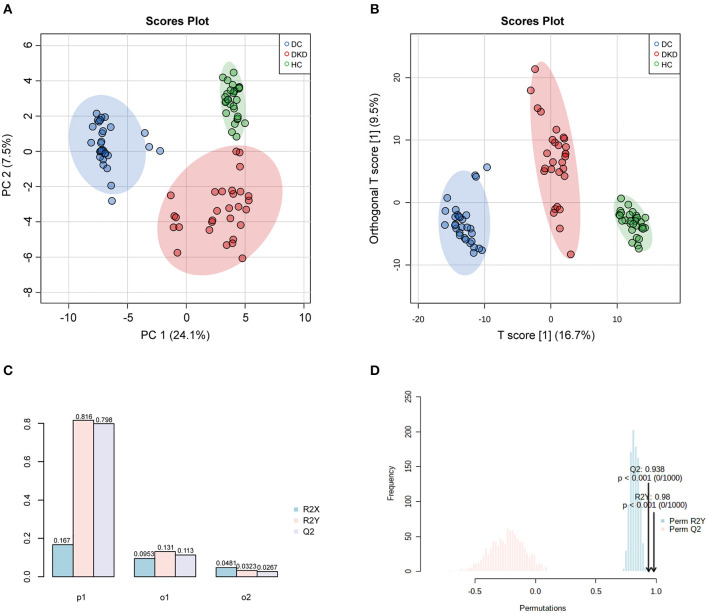
Figure 2.
Overall similarity and differences between samples by PCA and OPLS-DA analysis. (A) PCA score plots of healthy controls (HC), diabetic controls (DC), diabetic kidney disease patients [DKD, i.e., Diabetic nephropathy (DN)]. (B,C) OPLS-DA score and model overview plots of HC, DC, and DKD. (D) 1,000-times permutation test of the model showed its high strong reliability.

