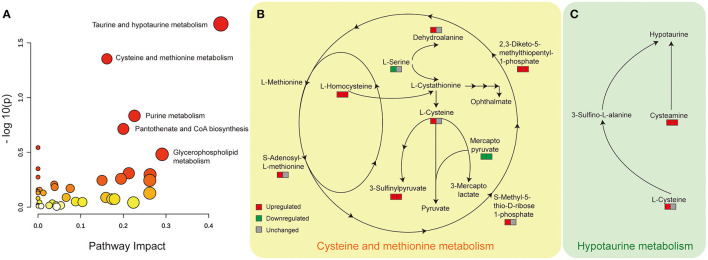
Figure 4.
Disturbed cysteine and methionine metabolism and hypotaurine metabolism pathway with significance identified from Metabanalyst in the comparison of DKD vs. DC, DKD-H vs. DKD-M. (A) Disturbed metabolic pathways were identified from the changed metabolites from the comparison of DKD vs. DC and DKD-H vs. DKD-M using serum samples. All matched pathways according to the p values from the pathway enrichment analysis and pathway impact values from the pathway topology analysis. The color of each node (varying from yellow to red) means the metabolites are in the data with different levels of significance, the size of each node represents the pathway impact values. (B) Altered serum metabolites in the cysteine and methionine metabolism pathway. The left square refers to the comparison of DKD vs. DC, the right square refers to the comparison of DKD-H vs. DKD-M. Red means upregulated more than 1.1 fold, Green means downregulated less than 0.91 fold, and gray means unchanged whose range between 0.91 and 1.1 in each comparison. (C) Altered serum metabolites in the hypotaurine metabolism pathway. Refer to (B) for the description of the figure.

