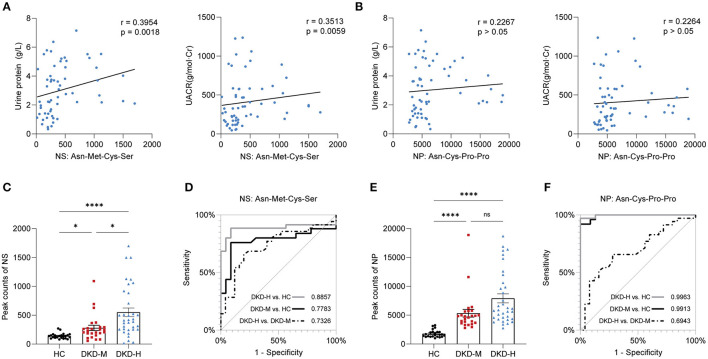
Figure 6.
Correlation with clinical parameters and prediction value. (A) Correlation of urine protein (g/L) and UACR (g/mol·Cr) with Asn-Met-Cys-Ser. (B) Correlation of urine protein (g/L) and UACR (g/mol·Cr) with Asn-Cys-Pro-Pro. (C) Individual value plots of Asn-Met-Cys-Ser in the validation group. (D) Area under the curve (AUC) of prediction models based on Asn-Met-Cys-Ser. (E) Individual value plots of Asn-Cys-Pro-Pro in the validation group. (F) Area under the curve (AUC) of prediction models based on Asn-Cys-Pro-Pro. The data are shown as the mean ± SEM. *P < 0.05 vs. the corresponding control group.

