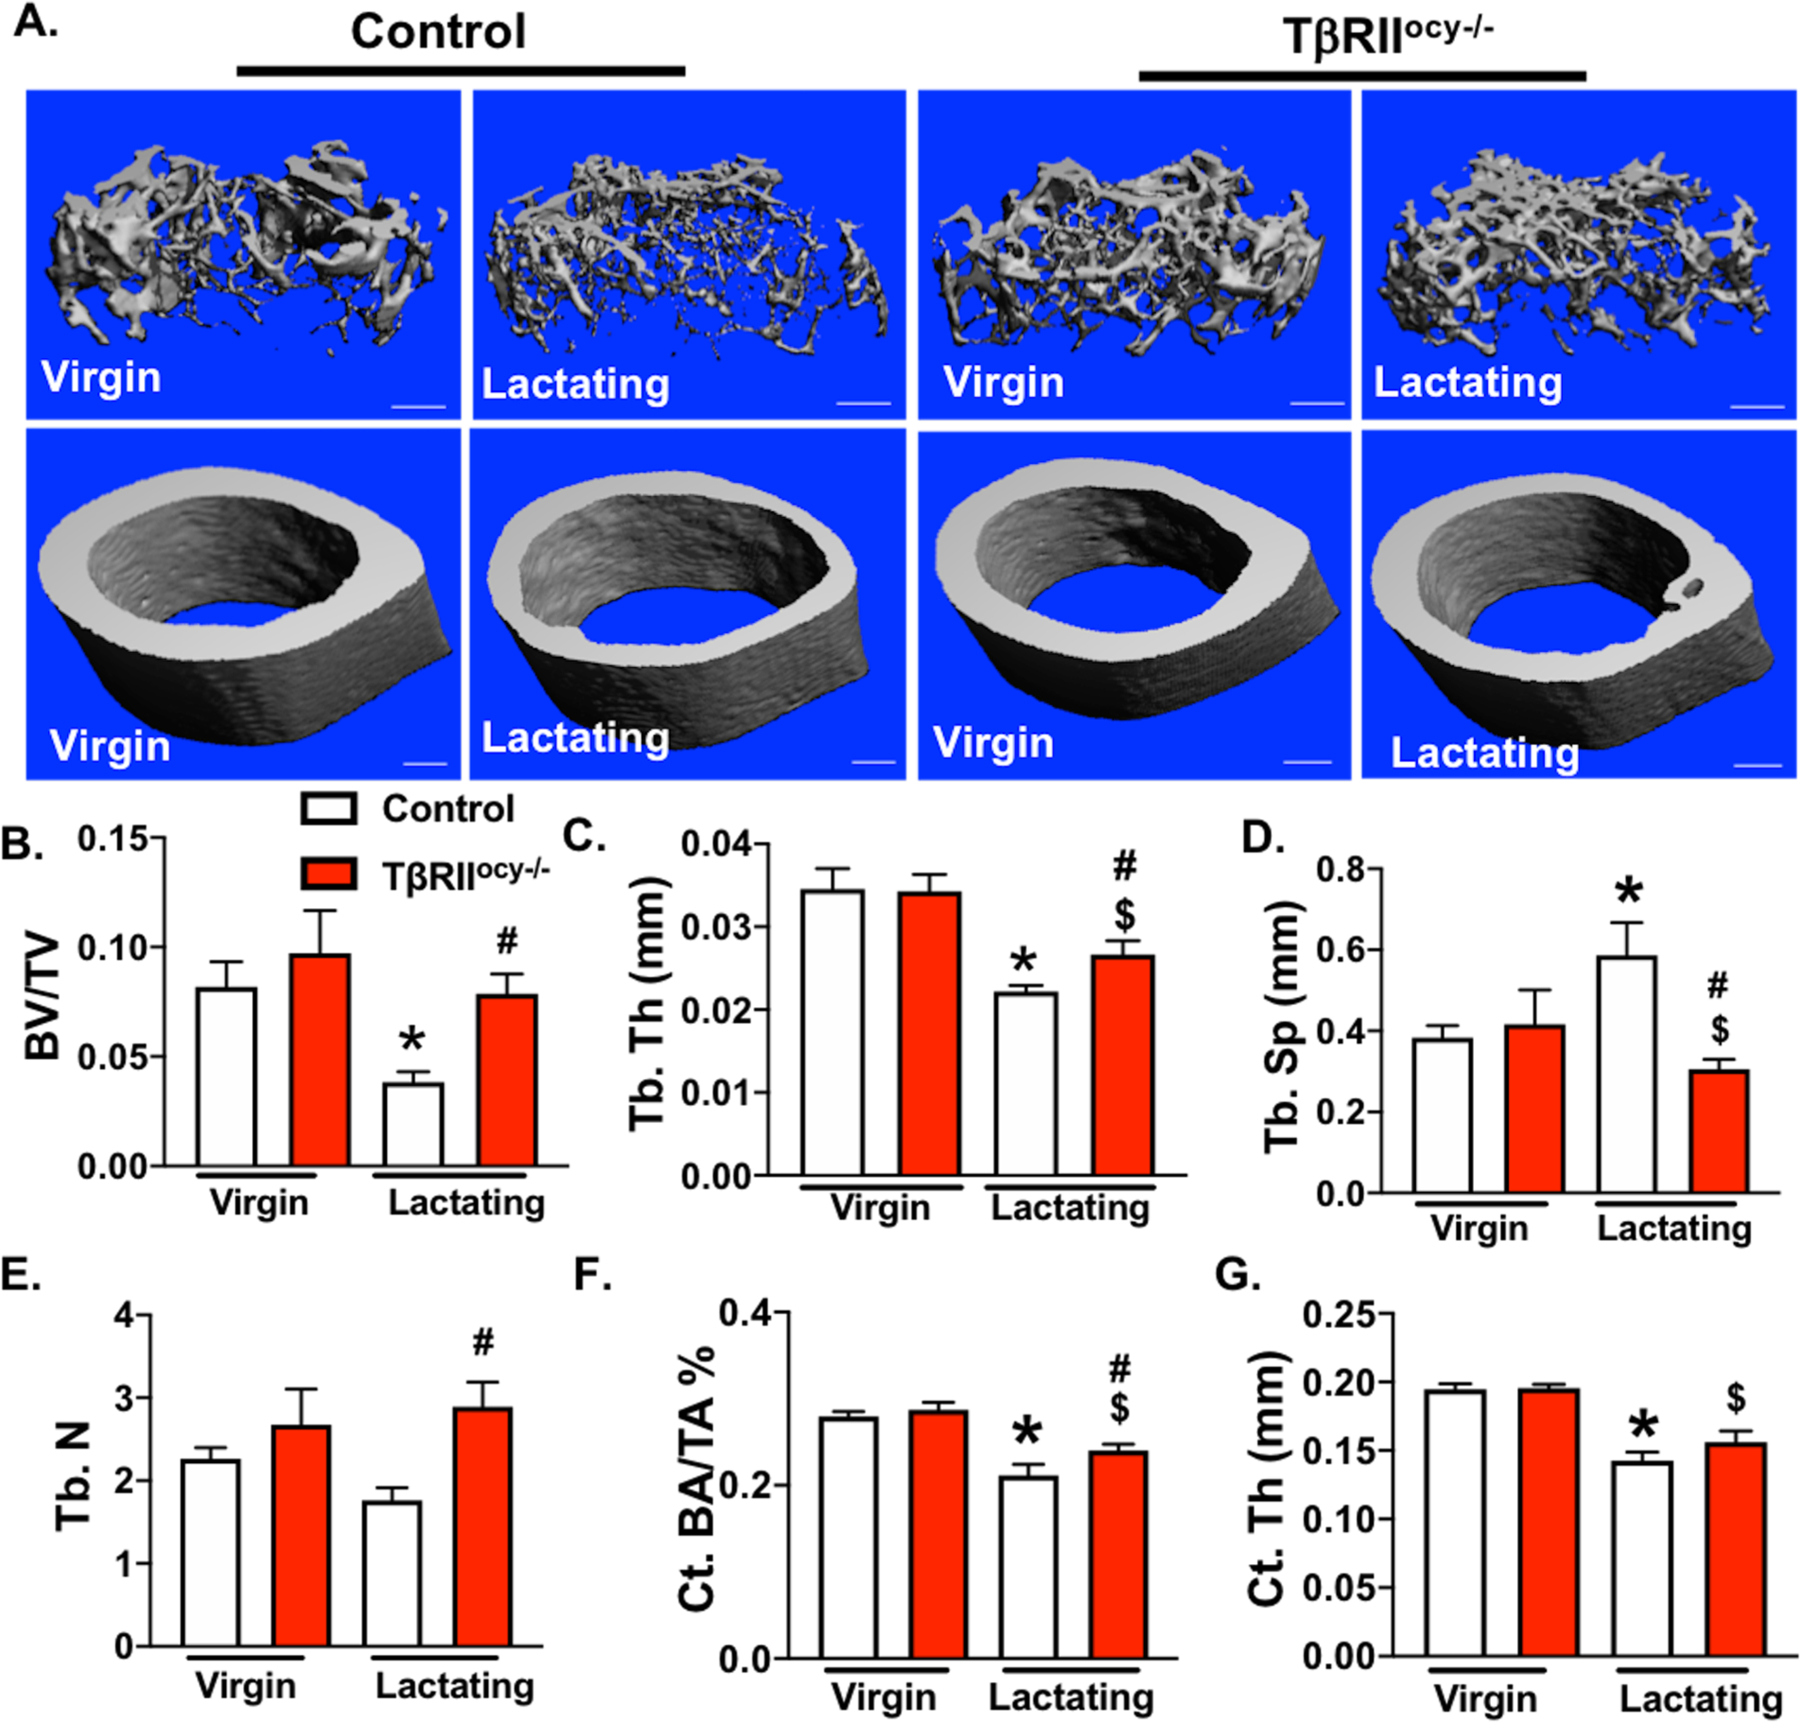
Figure 5. Lactation induced bone loss in TβRIIocy−/− is mitigated.

μCT analysis of femurs from 15-week old control and TβRIIocy−/− lactating female mice. Representative μCT reconstructions show trabecular (top) and cortical (bottom) bones (A). Decline in trabecular bone parameters: bone volume fraction (BV/TV), trabecular thickness (Tb.Th.), trabecular spacing (Tb.Sp.), and trabecular number (Tb.N) (B-E), and cortical bone parameters: cortical bone volume (Ct.BA/TA) and cortical thickness (Ct. Th), (F-G) in virgin and lactating mice of both genotypes is shown below. Scale bar, 100 μm (n = 6–10 mice/group). Error bars indicate mean ± SEM, *p<0.05 compared to control virgins, $p<0.05 compared to TβRIIocy−/− virgin group and #p<0.05 compared to control lactation group, as calculated from one-way ANOVA with Tukey post-hoc test.
