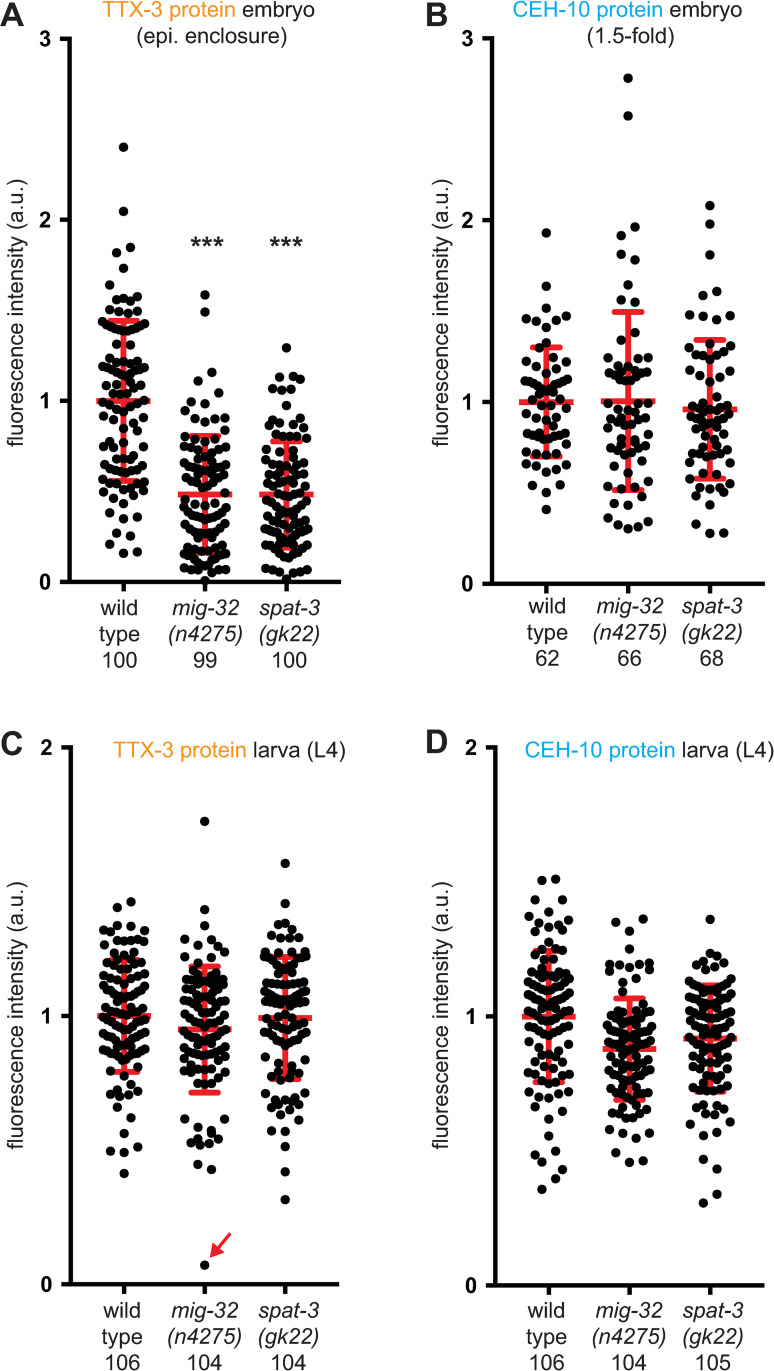
Fig 4. Effect of PRC1 mutants on TTX-3 and CEH-10 protein levels.
Quantification of the fluorescence levels (arbitrary units) in AIY neurons of: (A) TTX-3 protein (ttx-3endo::yfp (vba3)) at epidermal enclosure embryonic stage; (B) CEH-10 protein (ceh-10endo::yfp (vba1)) at 1.5-fold embryonic stage; (C, D) TTX-3 protein (ttx-3endo::mkate2 (vba6)) and CEH-10 protein (ceh-10endo::yfp (vba1)) at L4 larval stage in the same neurons. Only neurons where expression was detected were analyzed. Each dot represents one neuron. The number of positive neurons analyzed for each condition (wild type, mig-32(n4275) or spat-3(gk22)) is presented below the genotype. The red bars represent the mean and SD. A Mann-Whitney U-test was used to compare the medians (*** p<0.001).

