Fig. 2.

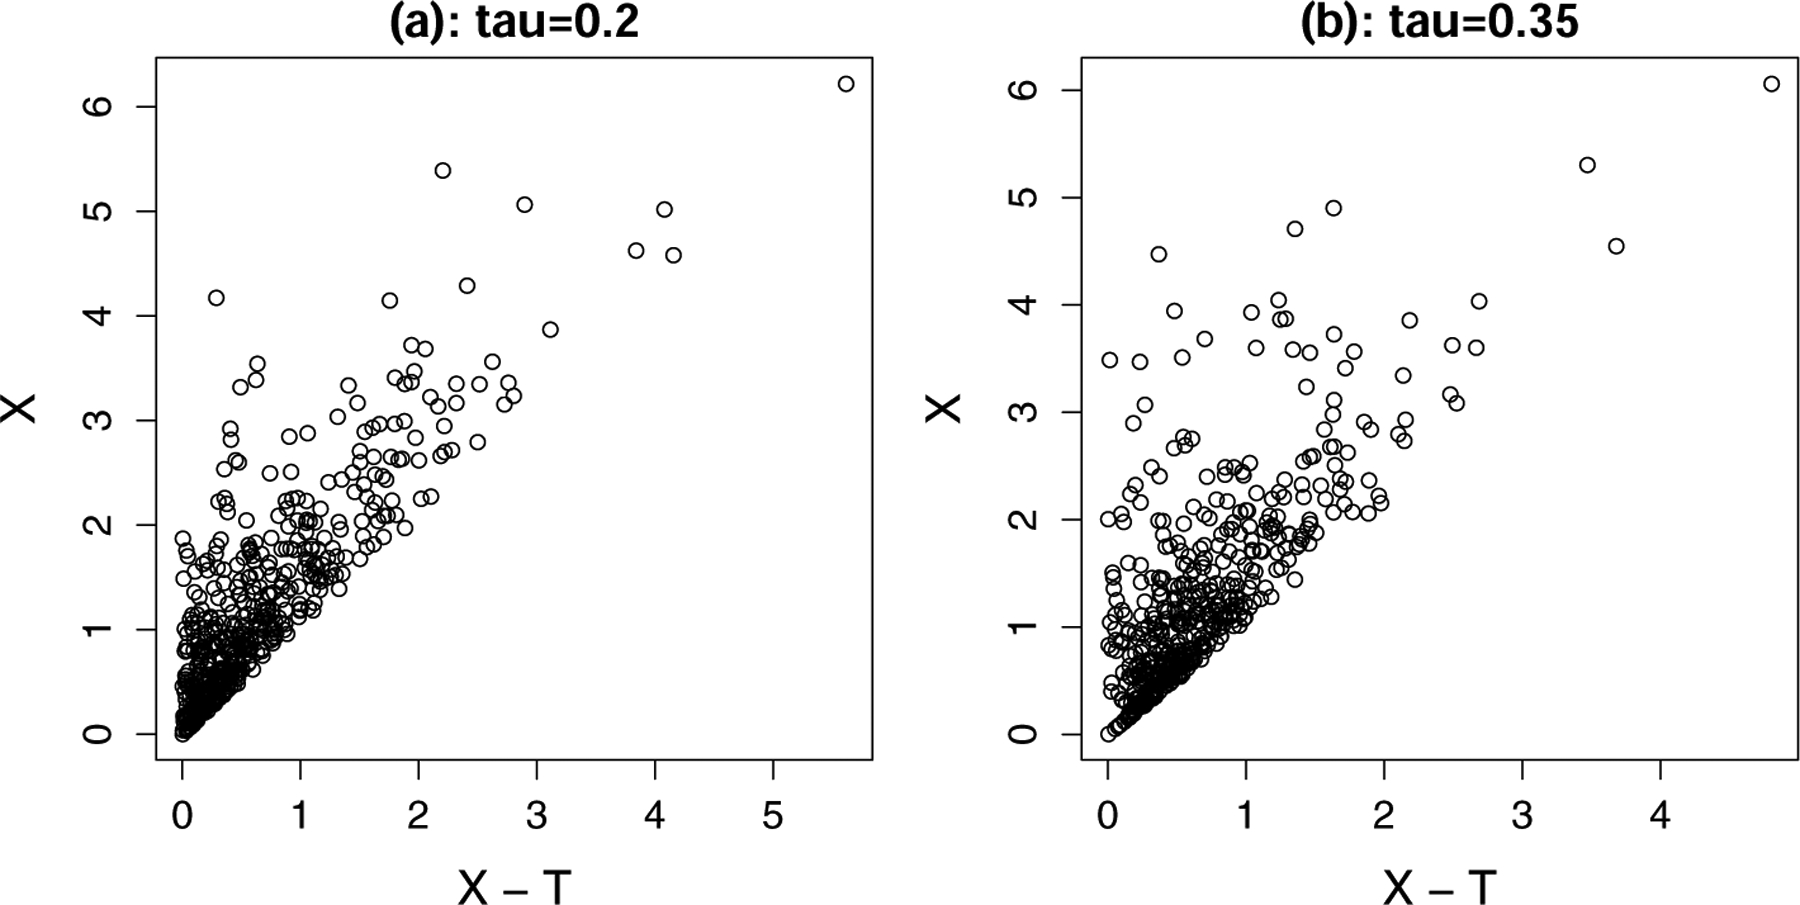
Scatter plots of X − T vs. X given X > T. The plot on the left has post-truncation conditional Kendall’s tau of 0.2, and that on the right has conditional Kendall’s tau of 0.35.

Scatter plots of X − T vs. X given X > T. The plot on the left has post-truncation conditional Kendall’s tau of 0.2, and that on the right has conditional Kendall’s tau of 0.35.