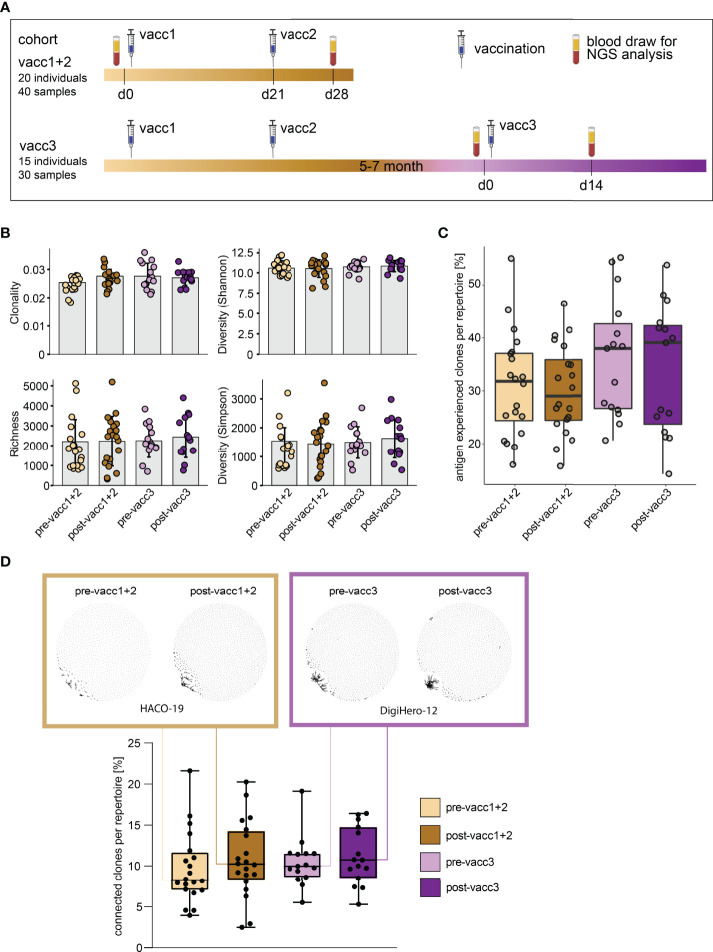
Figure 3.
Matched pre- and post-SARS-CoV-2 vaccination blood sampling and global B cell repertoire analysis. (A) Vaccination and blood sampling scheme. (B) Broad B cell repertoire metrics. Bars indicate mean ± standard deviation. (C) Percentage of antigen experienced clones with somatic hypermutation (<98% identity to germline) per B cell repertoire. Box and whiskers plot are shown in the style of Tukey. (D) Quantitative connectivity analysis of B cell clones per repertoire. A clone is defined as a unique CDR3aa sequence. Clones are connected if they have a Levenshtein distance of ≤ 3 are connected. Boxes outline 25th to 75th percentile with a line at the median and whiskers from minimum to maximum. Petri dish plots of two representative pre-/post vaccination B cell repertoires are shown in brown and violet boxes on top (patients HACO-19 and DigiHero-12). Each dot in the petri dish plot represents one clone.

