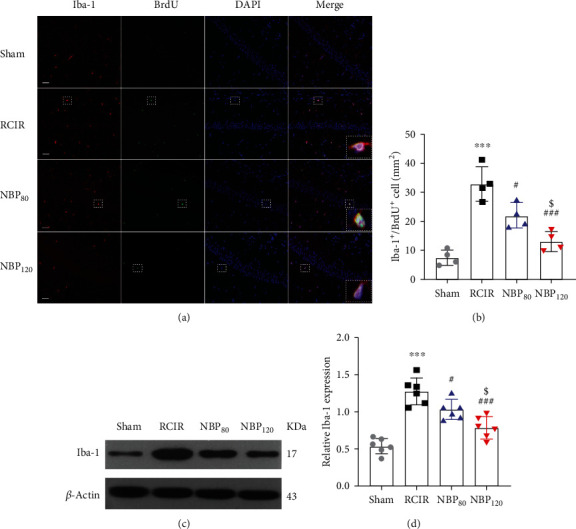
Figure 4.

NBP suppressed the activation and regeneration of microglial cells after RCIR. (a) Representative images of double immunofluorescence labeling of Iba-1 (red) and BrdU (green) (200×) in CA1 regions of the hippocampus 4 weeks after RCIR. Iba1+/BrdU+ cells represented microglial proliferation. Bar = 50 μm. Typical double-labeled areas were magnified. n = 4 in each group. (b) The number of Iba-1+/BrdU+ cells in hippocampal CA1 regions. (c, d) Western blot and quantitative analysis of the expressions of Iba-1. n = 6 in each group. β-Actin was used as an internal control. ∗∗∗P < 0.001, the RCIR group vs. sham group; #P < 0.05, ###P < 0.001, the NBP80 group or the NBP120 group vs. the RCIR group; $P < 0.05, the NBP80 group vs. NBP120 group. Values are expressed as the mean ± SD. Iba-1: ionized calcium-binding adapter molecule.
