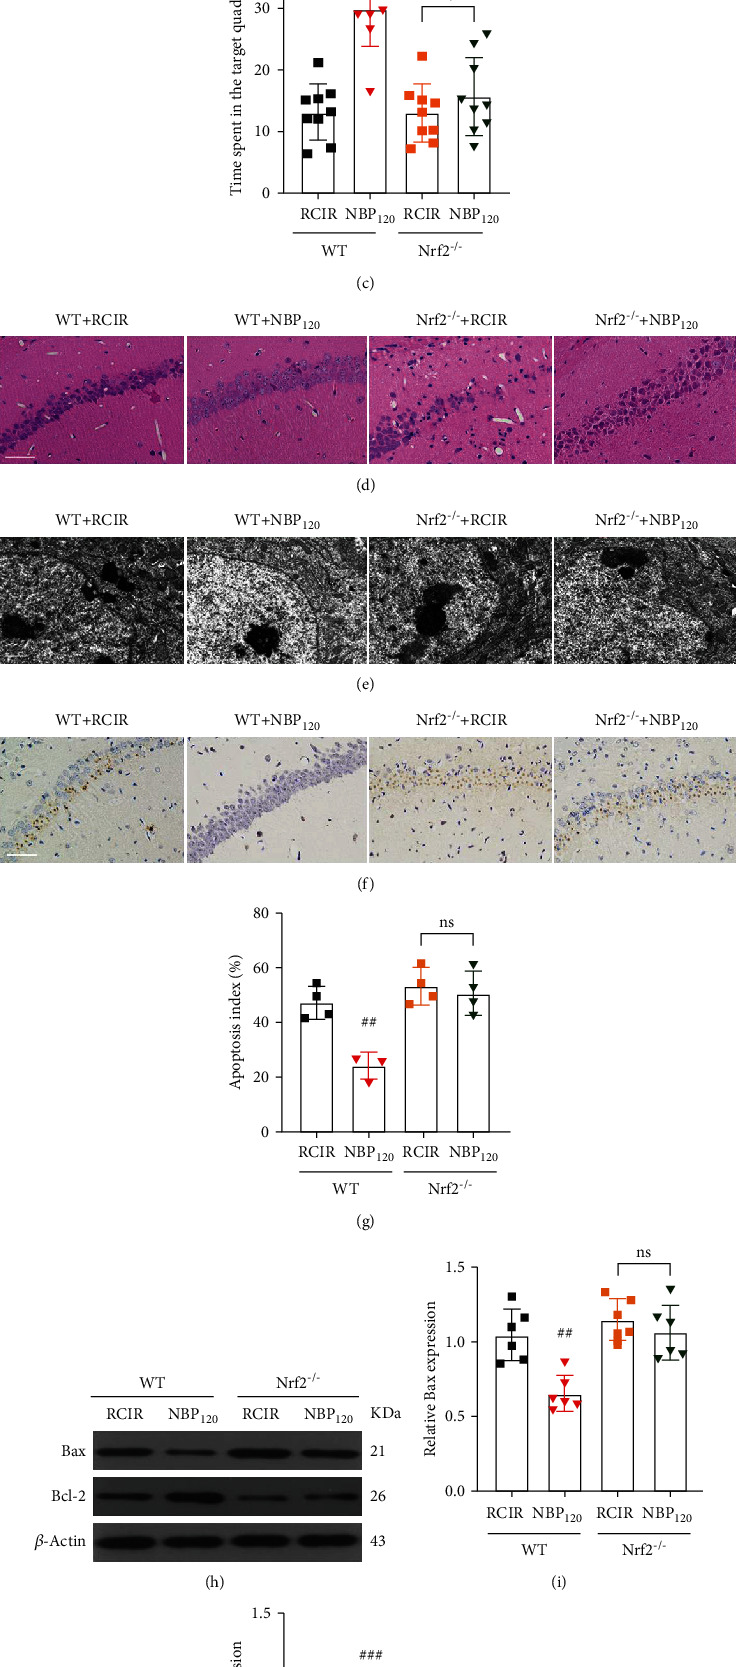
Figure 9.

The neuroprotective effects of NBP were abolished in Nrf2−/− mice. (a)–(c) Quantification of time latency, swimming speed, and the percentage of time spent in the target quadrant was measured in WT and Nrf2−/− mice using MWM. n = 9 per group. (d)–(f) Representative images of HE staining (400×, scale bar = 50 μm), the ultrastructure of neurons (scale bar = 1 μm), and TUNEL staining (400×, scale bar = 50 μm) in the hippocampal CA1 region. (g) The quantitative graph for TUNEL staining of the hippocampus. n = 3 or 4 per group. (h)–(j) Western blot analysis of Bax and Bcl-2 expression. n = 6 per group. β-Actin was used as an internal control. ##P < 0.05, ###P < 0.001, the WT + NBP120 vs. the WT + RCIR group; ns: not significant, as indicated. Values are expressed as mean ± SD.
