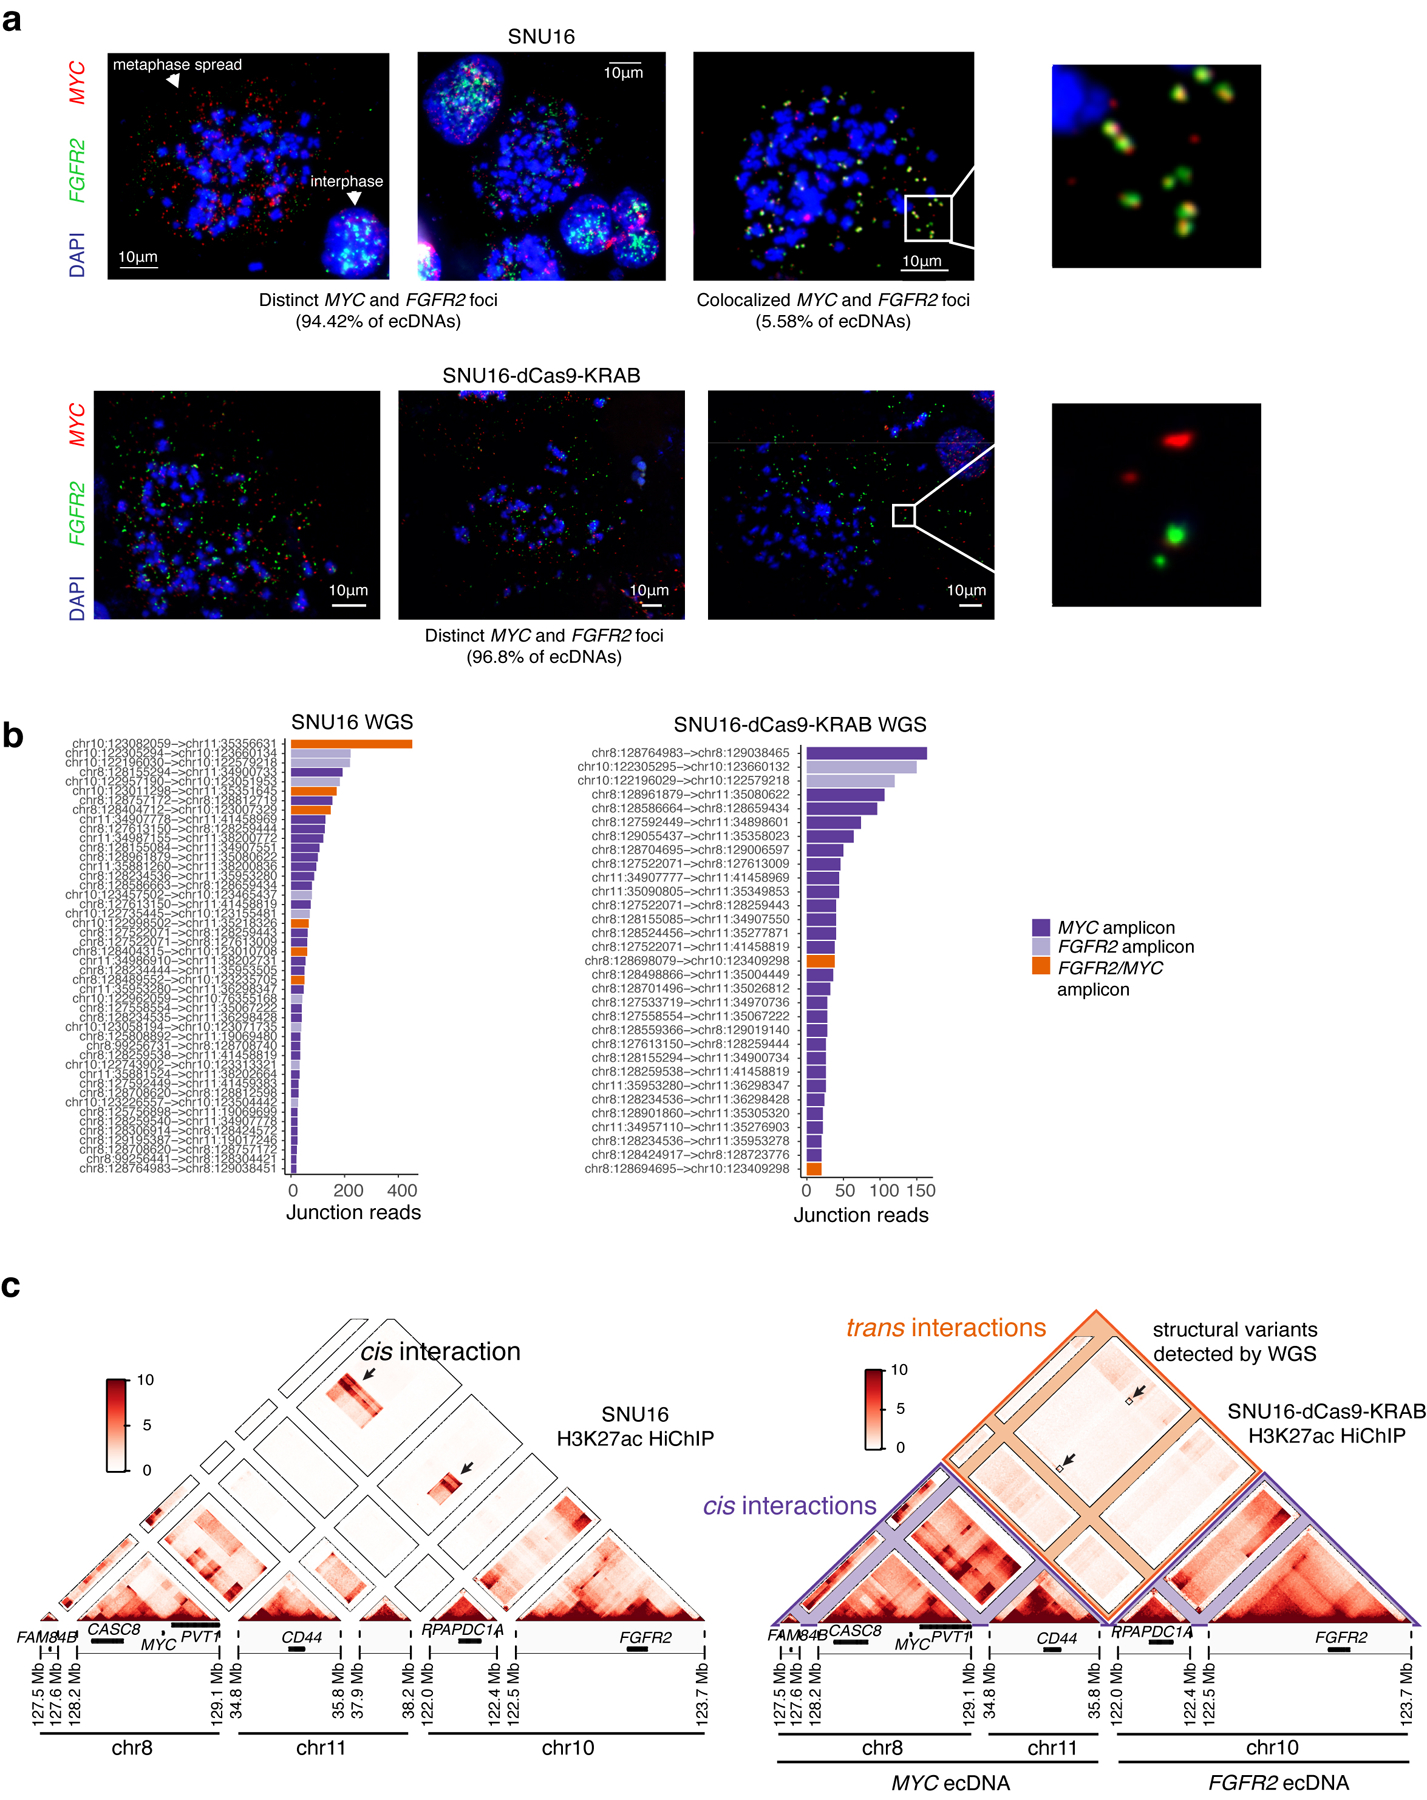
Extended Data Figure 7. Generation of monoclonal SNU16-dCas9-KRAB with reduced ecDNA fusions.

(a) Representative DNA FISH images showing extrachromosomal single-positive MYC and FGFR2 amplifications (top left and top middle) and double-positive MYC and FGFR2 amplifications in metaphase spreads in parental SNU16 cells (top right) with zoom in (top right). N = 42 cells and 8,222 ecDNAs. Representative DNA FISH images showing distinct extrachromosomal MYC and FGFR2 amplifications in metaphase spreads in SNU16-dCas9-KRAB cells (bottom). N = 29 cells and 3,893 ecDNAs. (b) Ranked plot showing number of junction reads supporting each breakpoint in AmpliconArchitect. Breakpoints are colored based on whether they span regions from the same amplicon (MYC/FGFR2) or regions from two distinct amplicons. (c) HiChIP contact matrices at 10kb resolution with KR normalization for parental SNU16 cell line (left) and SNU16-dCas9-KRAB cell line (right). Contact matrix for parental cells contains regions of increased cis contact frequency between chr8 and chr10 as indicated, as compared to SNU16-dCas9-KRAB cells with highly reduced contact cis frequency between chr8 and chr10. Regions of increased focal interaction overlapping low frequency structural rearrangements between chr8 and chr10 described in panel (a) indicated with boxes.
