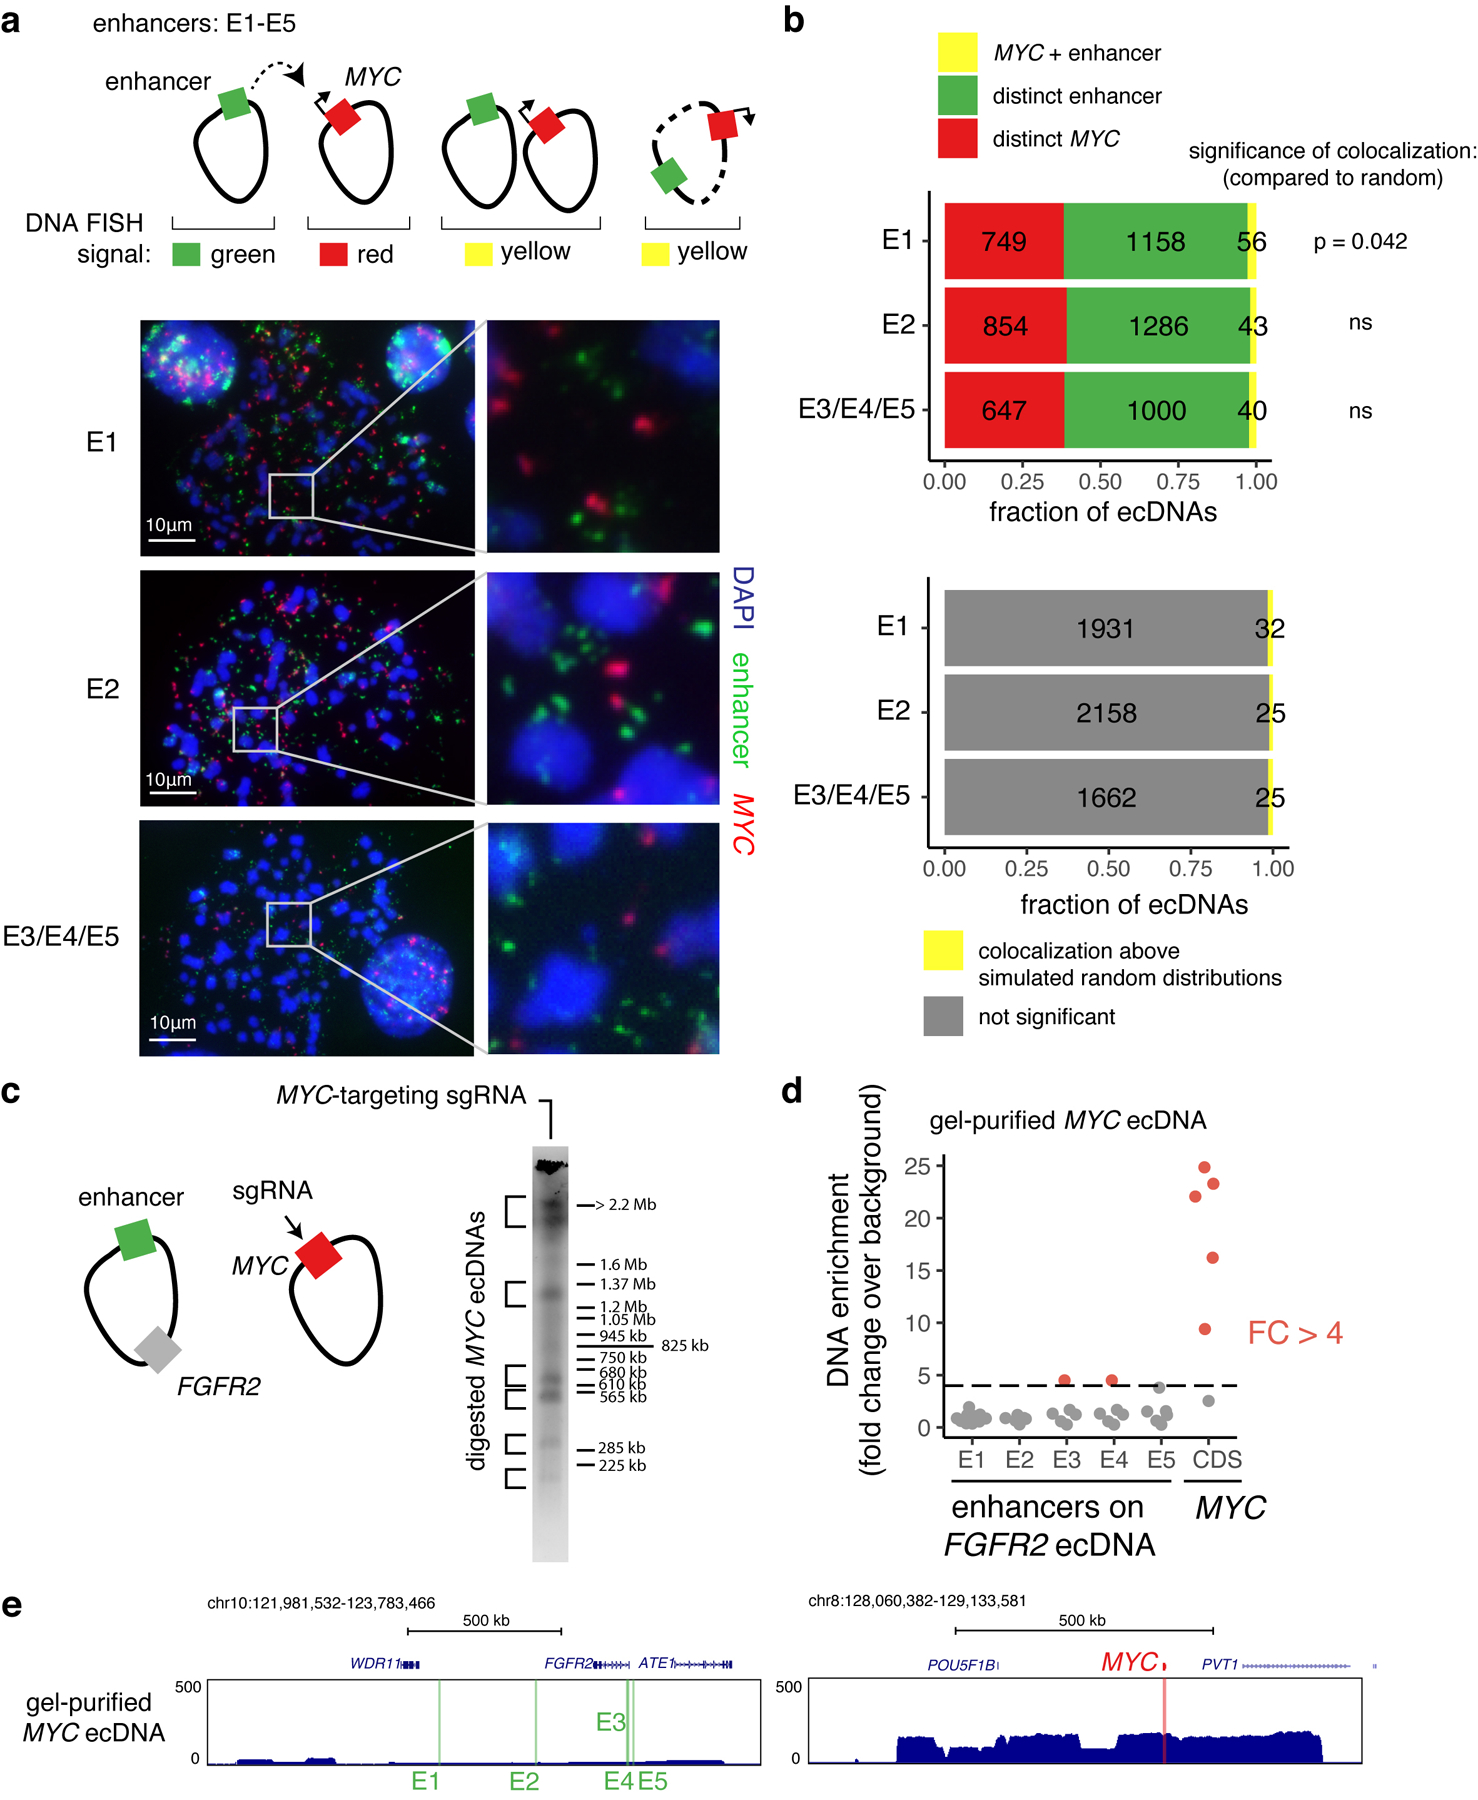
Extended Data Figure 9. Intermolecular enhancers and MYC are located on distinct molecules for the vast majority of ecDNAs.

(a) Top: two-color DNA FISH on metaphase spreads for quantifying the frequency of colocalization of the MYC gene and intermolecular enhancers shown in Figure 4e. Above-random colocalization would indicate fusion events. Bottom: representative DNA FISH images. DNA FISH probes target the following hg19 genomic coordinates: E1, chr10:122635712–122782544 (RP11–95I16; n = 11 cells); E2, chr10:122973293–123129601 (RP11-57H2; n = 12 cells); E3/E4/E5, chr10:123300005–123474433 (RP11–1024G22; n = 10 cells). (b) Top: numbers of distinct and colocalized FISH signals. To estimate random colocalization, 100 simulated images were generated with matched numbers of signals and mean simulated frequencies were compared with observed colocalization. P values determined by two-sided t-test (Bonferroni-adjusted). Bottom: number of colocalized signals significantly above random chance. Colocalization above simulated random distributions is the sum of colocalized molecules in excess of random means in all FISH images in which total colocalization was above the random mean plus 95% confidence interval (100 simulated images per FISH image). (c) in-vitro Cas9 digestion of MYC-containing ecDNA in SNU16-dCas9-KRAB followed by PFGE (one independent experiment). Fragment sizes were determined based on H. wingei and S. cerevisiae ladders. Uncropped gel image is in Supplementary Figure 1. MYC CDS guide corresponds to guide B in Supplementary Table 2. (d) Enrichment of enhancer DNA sequences in isolated MYC ecDNAs bands from (c) over background (DNA isolated from a separate PFGE lane in the corresponding size range resulting from undigested genomic DNA) based on normalized reads in 5kb windows. Each dot represents DNA from a distinct gel band. Red indicates fold change above 4. (e) Sequencing track for a gel-purified MYC ecDNA showing enrichment of the MYC amplicon and depletion of the FGFR2 amplicon containing enhancers E1–E5.
