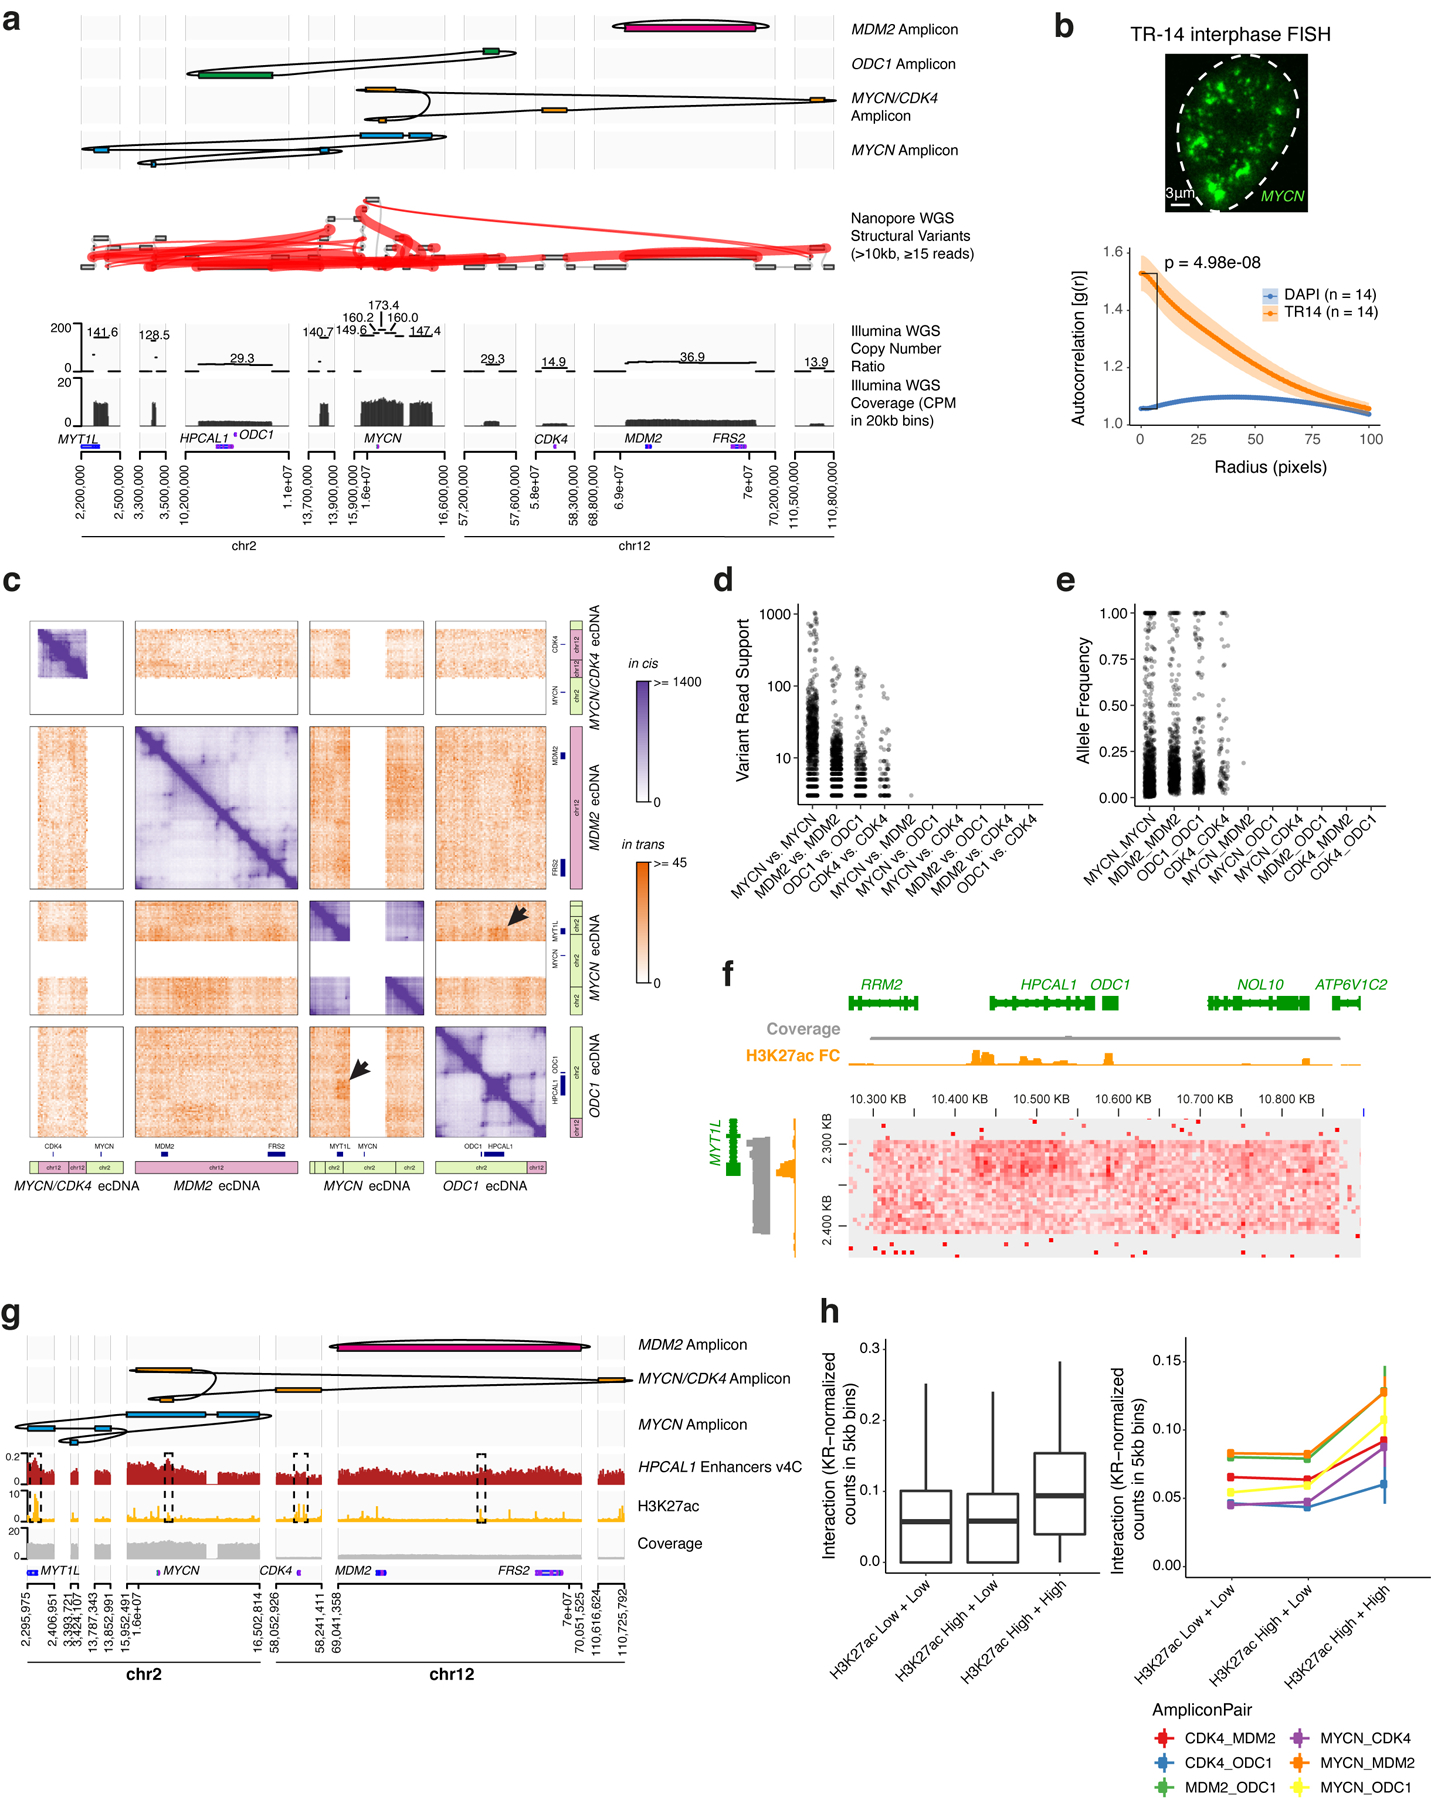
Extended Data Figure 10. Reconstruction of four distinct amplicons in TR14 neuroblastoma cell line and intermolecular amplicon interaction patterns associated with H3K27ac marks.

(a) Top to bottom: long read-based reconstruction of four different amplicons; genome graph with long read-based structural variants of >10kb size and >20 supporting reads indicated by red edges; copy number variation and coverage from short-read whole-genome sequencing, positions of the selected genes. (b) A representative DNA FISH image of MYCN ecDNAs in interphase TR14 cells (top) and ecDNA clustering compared to DAPI control in the same cells assessed by autocorrelation g(r) (bottom). Data are mean ± SEM (n = 14 cells). (c) Custom Hi-C map of reconstructed TR14 amplicons. The MYCN/CDK4 amplicon and the MYCN ecDNA share sequences, which prevented an unambiguous short-read mapping in these regions and appear as white areas. Trans interactions appear locally elevated between MYCN ecDNA and ODC1 amplicon (indicated by arrows). Cis and trans contact frequencies are colored as indicated. (d) Read support for structural variants identified by long read sequencing overlapping amplicons. Only one structural variant between distinct amplicons (MYCN and MDM2 amplicons) was identified with 3 supporting reads. (e) Variant allele frequency for structural variants overlapping amplicons. (f) Trans-interaction pattern between enhancers on a MYCN amplicon fragment (vertical) and an ODC1 amplicon fragment (horizontal). Short-read WGS coverage (grey), H3K27ac ChIP-seq track showing mean fold change over input in 1kb bins (yellow) and Hi-C contact map showing (KR-normalized counts in 5kb bins). (g) Top to bottom: three amplicon reconstructions, virtual 4C interaction profile of the enhancer-rich HPCAL1 locus on the ODC1 amplicon with loci on other amplicons (red), and H3K27ac ChIP-seq (fold change over input; yellow). (h) Trans interaction between different amplicons (KR-normalized counts in 5kb bins) depending on H3K27ac signal of the interaction loci (left; box center line, median; box limits, upper and lower quartiles; box whiskers, 1.5x interquartile range). Trans interaction (KR-normalized counts in 5kb bins) separated by amplicon pair (right). H3K27ac High vs. Low denotes at least vs. less than 3-fold mean enrichment over input in 5kb bins. N = 114,636 H3K27ac Low + Low pairs, n = 11,990 H3K27ac High + Low pairs, n = 296 H3K27ac High + High pairs.
