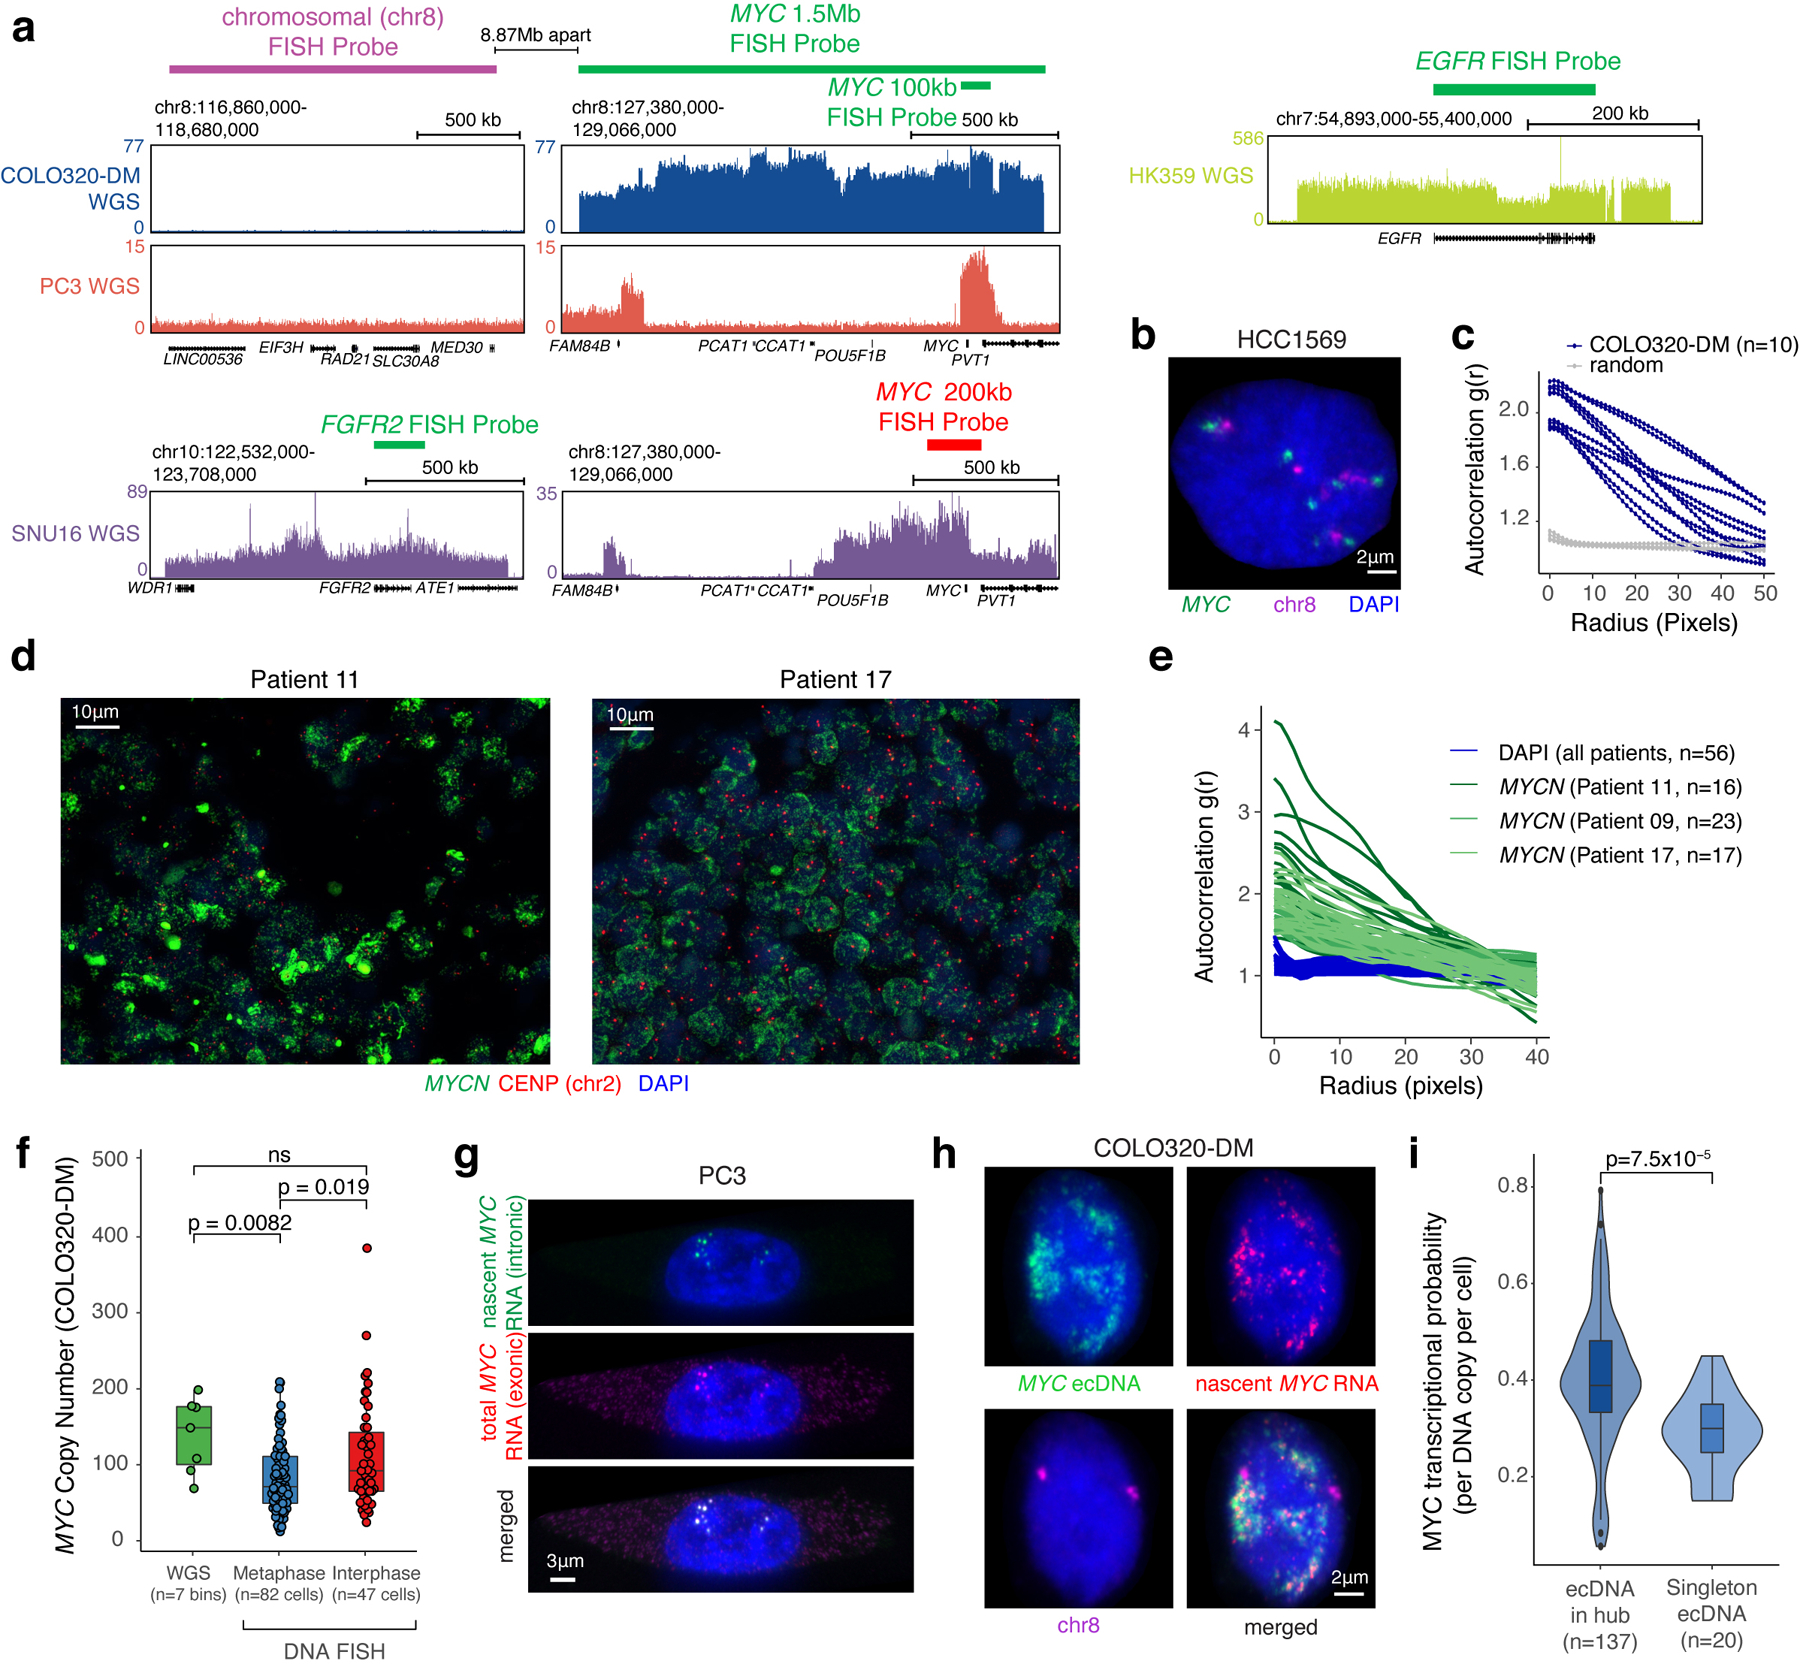
Extended Data Figure 1. ecDNA FISH strategies and copy number estimation.

(a) WGS tracks with DNA FISH probe locations. For COLO320-DM and PC3, a 1.5 Mb MYC FISH probe (Figure 1a,b), a 100 kb MYC FISH probe (Figure 1d,e,f), or a 1.5 Mb chromosome 8 FISH probe was used. Commercial probes were used in SNU16 and HK359 cells. (b) Representative DNA FISH image using chromosomal and 1.5 Mb MYC probes in non-ecDNA amplified HCC1569 showing paired signals as expected from the chromosomal loci. (c) ecDNA clustering of individual COLO320-DM cells by autocorrelation g(r). (d) Representative FISH images showing ecDNA clustering in primary neuroblastoma tumors (Patients 11 and 17). (e) ecDNA clustering of individual primary tumor cells from all three patients using autocorrelation g(r). (f) Comparison of MYC copy number in COLO320-DM calculated based on WGS (n=7 genomic bins overlapping with DNA FISH probes), metaphase FISH (n=82 cells) and interphase FISH (n=47 cells). P-values determined by two-sided Wilcoxon test. (g) Representative images of nascent MYC RNA FISH showing overlap of nascent RNA (intronic) and total RNA (exonic) FISH probes in PC3 cells (independently repeated twice). (h) Representative images from combined DNA FISH for MYC ecDNA (100 kb probe) and chromosomal DNA with nascent MYC RNA FISH in COLO320-DM cells (independently repeated four times). (i) MYC transcription probability measured by nascent RNA FISH normalized to DNA copy number by FISH comparing singleton ecDNAs to those found in hubs in COLO320-DM (box center line, median; box limits, upper and lower quartiles; box whiskers, 1.5x interquartile range). To control for noise in transcriptional probability for small numbers of ecDNAs, we randomly re-sampled RNA FISH data grouped by hub size and calculated transcription probability. The violin plot represents transcriptional probability per ecDNA hub based on the hub size matched sampling. P-value determined by two-sided Wilcoxon test.
