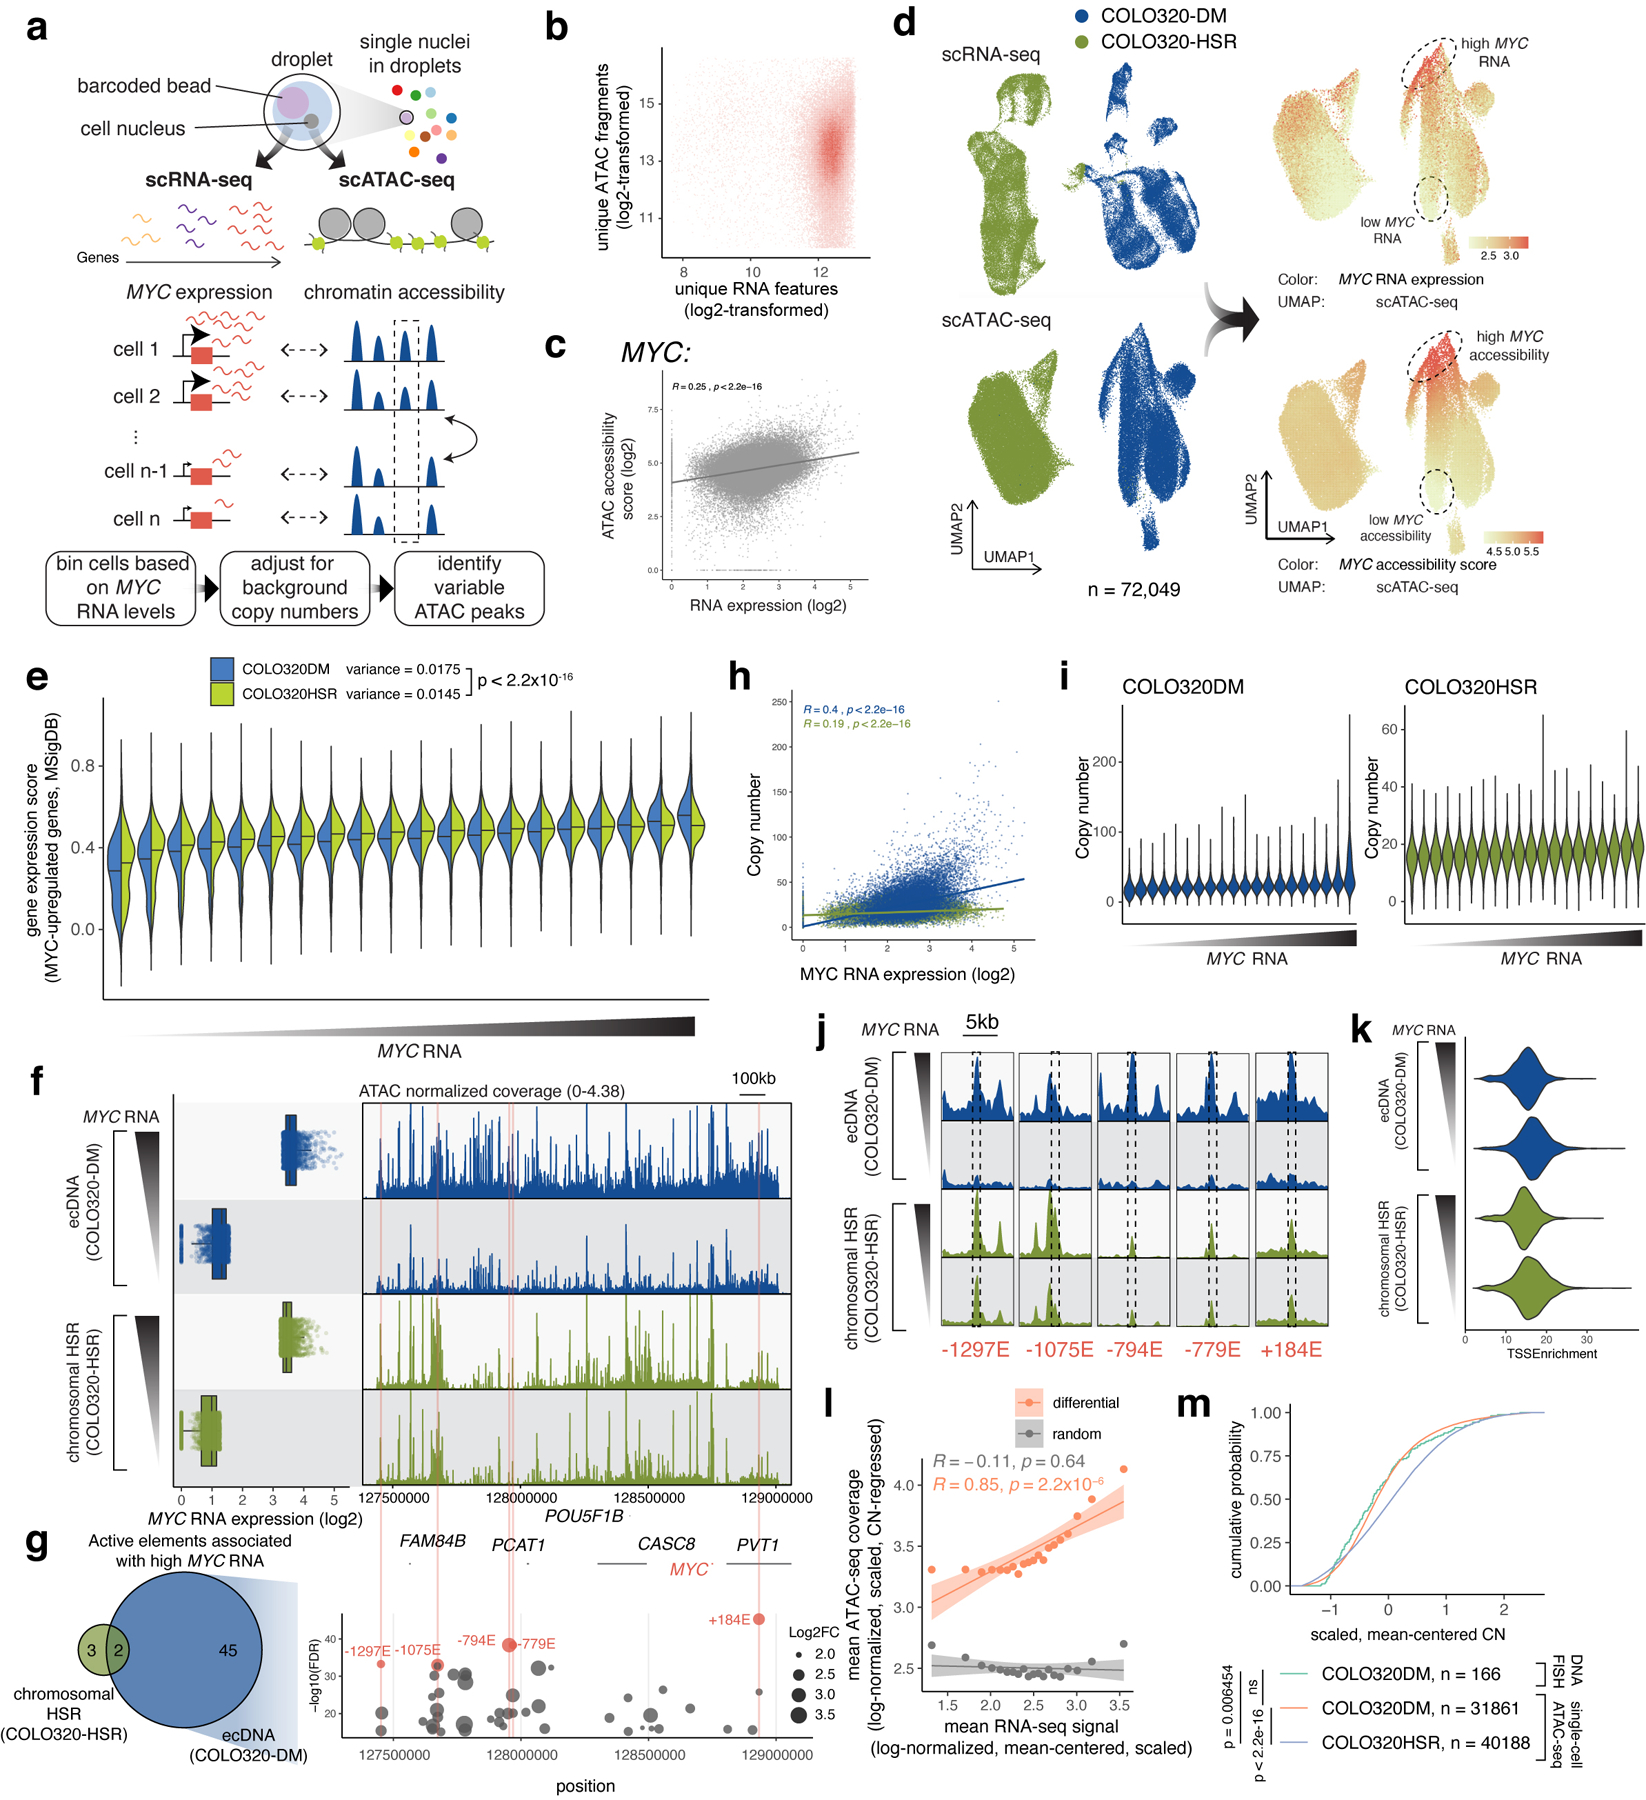
Extended Data Figure 5. Single-cell multiomic analysis reveals combinatorial and heterogeneous ecDNA regulatory element activities associated with MYC expression.

(a) Joint single-cell RNA and ATAC-seq for simultaneously assaying gene expression and chromatin accessibility and identifying regulatory elements associated with MYC expression. (b) Unique ATAC-seq fragments and RNA features for cells passing filter (both log2-transformed). (c) Correlation between MYC accessibility score and normalized RNA expression. (d) UMAP from the RNA or the ATAC-seq data (left). Log-normalized and scaled MYC RNA expression (top right) and MYC accessibility scores (bottom right) were visualized on the ATAC-seq UMAP. (e) Gene expression scores (using Seurat in R) of MYC-upregulated genes (Gene Set M6506, Molecular Signatures Database; MSigDB) across all MYC RNA quantile bins. Horizontal line marks median. Population variances for all individual cells are shown (top). P-value determined by two-sided F-test. (f) MYC expression levels of top and bottom bins (left). Normalized ATAC-seq coverages are shown (right). (g) Number of variable elements identified on COLO320-DM ecDNAs compared to chromosomal HSRs in COLO320-HSR (left). 45 variable elements were uniquely observed on ecDNA. All variable elements on ecDNA are shown on the right (y-axis shows −log10(FDR) and dot size represents log2 fold change. Five most significantly variable elements are highlighted and named based on relative position in kilobases to the MYC TSS (negative, 5’; positive, 3’). (h) Correlation between estimated MYC copy numbers and normalized log2-transformed MYC expression of all individual cells showing a high level of copy number variability. (i) Estimated MYC amplicon copy number of all cell bins. (j) Zoom-ins of the ATAC-seq coverage of each of the five most significantly variable elements identified in (g) (marked by dashed boxes). (k) Similar distributions of TSS enrichment in the high and low cell bins. (l) Mean copy number regressed, log-normalized, scaled ATAC-seq coverage of the differential peaks against mean MYC RNA (log-normalized, mean-centered, scaled) for each cell bin in orange. Same number of random non-differential peaks from the same amplicon interval and shown in grey. Error bands show 95% confidence intervals for the linear models. (m) Cumulative probability of MYC amplicon copy number distributions (mean-centered, scaled) of single-cell ATAC-seq data and DNA FISH data. P-values determined by Kolmogorov-Smirnov test (1000 bootstrap simulations).
